Workday for finance teams
Smarter planning, driven by Workday Adaptive Planning
Workday Adaptive Planning helps finance teams with better Financial Planning and Analysis. Let’s solve your budgeting, forecasting, planning and reporting challenges.

Planning challenges
Still stuck in spreadsheets?
We understand the frustration. Finance professionals often spend excessive time on manual tasks, arduous data manipulation,
and error-checking spreadsheets. This leaves little time for strategic and more value-adding work.
Why Workday Adaptive Planning?
Modern financial planning capabilities
Workday Adaptive Planning is a market-leading Financial Planning and Analysis solution built specifically for finance teams. It has been recognised as a 2023, 2024 and 2025 Gartner Customer’s Choice for Planning Software.
a powerful FP&A tool
Workday Adaptive Planning
features and capabilities
Workday Adaptive Planning is a cloud technology trusted by over 7,000 customers globally. It provides budgeting, forecasting, reporting and data visualisation services to help organisations better manage their business, improve performance, and make smarter decisions.
Budgeting
and Forecasting
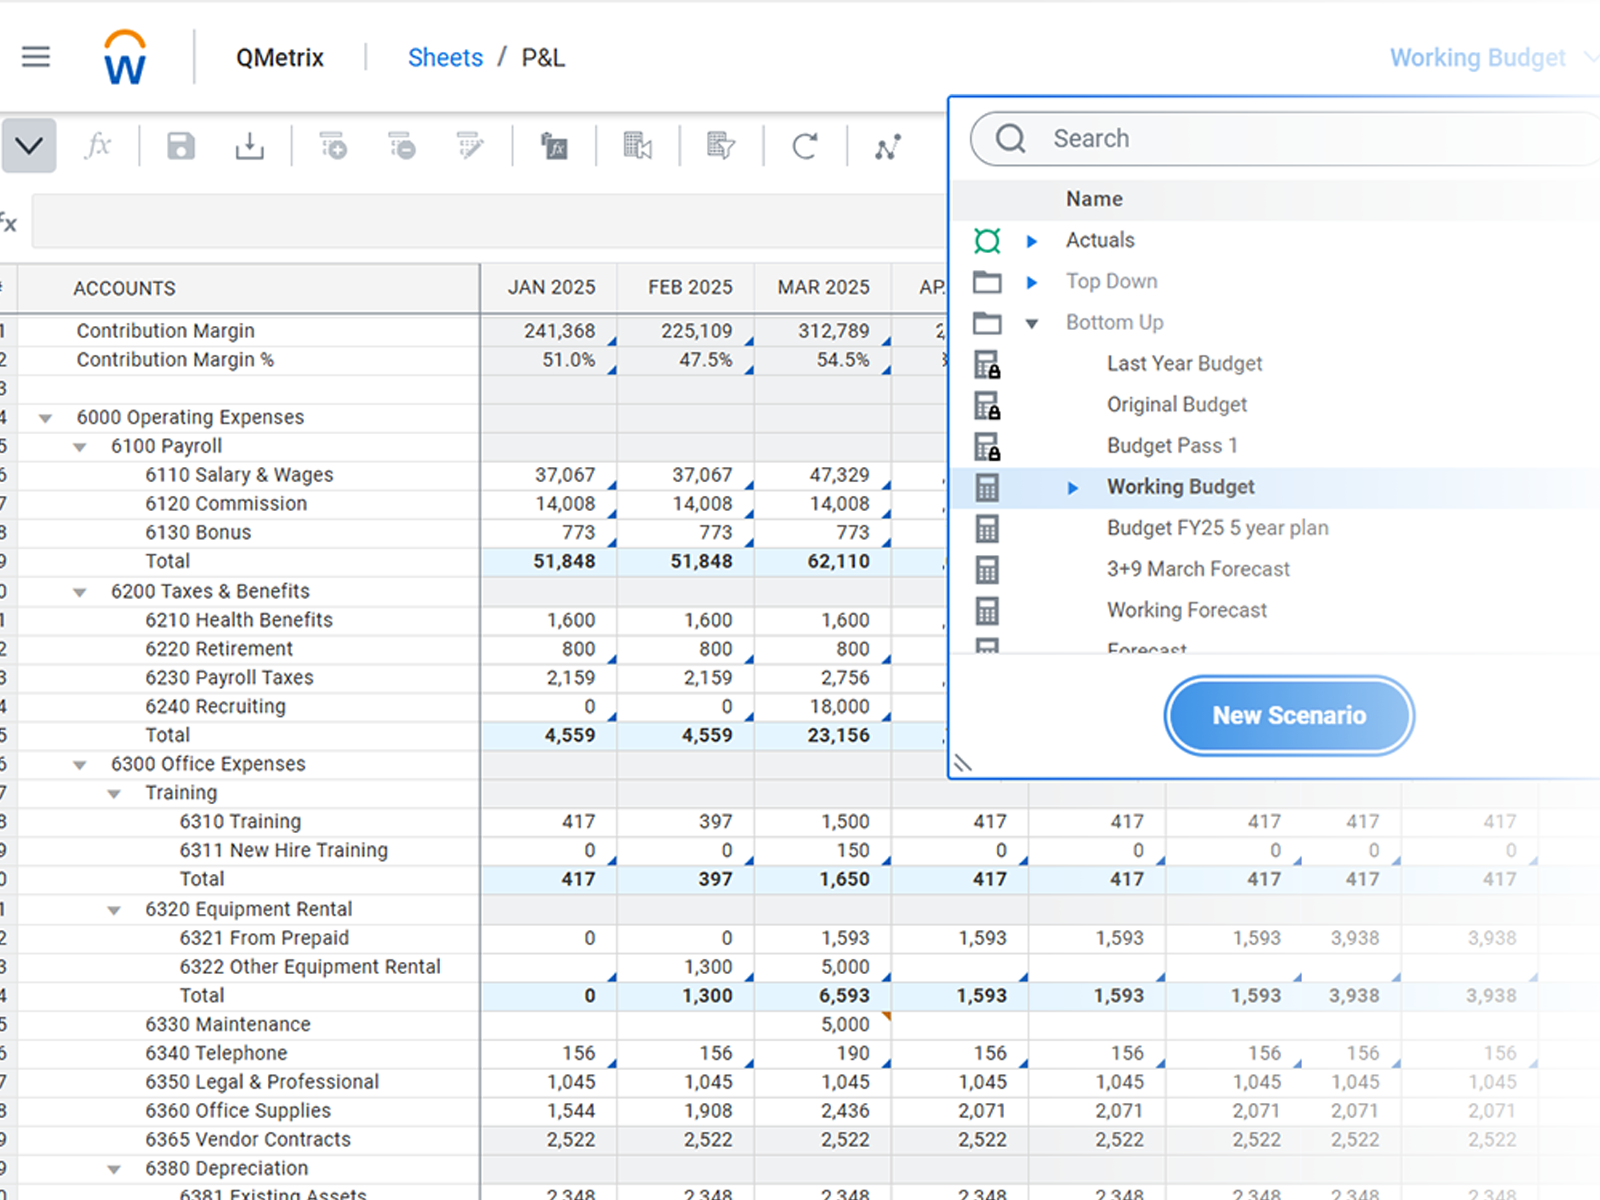
Workday Adaptive Planning delivers fast, flexible budgeting and forecasting with intuitive, Excel-like modelling. Its cloud engine enables real-time updates, driver-based plans and seamless collaboration.
This helps finance teams boost accuracy,
agility and confidence in every plan.
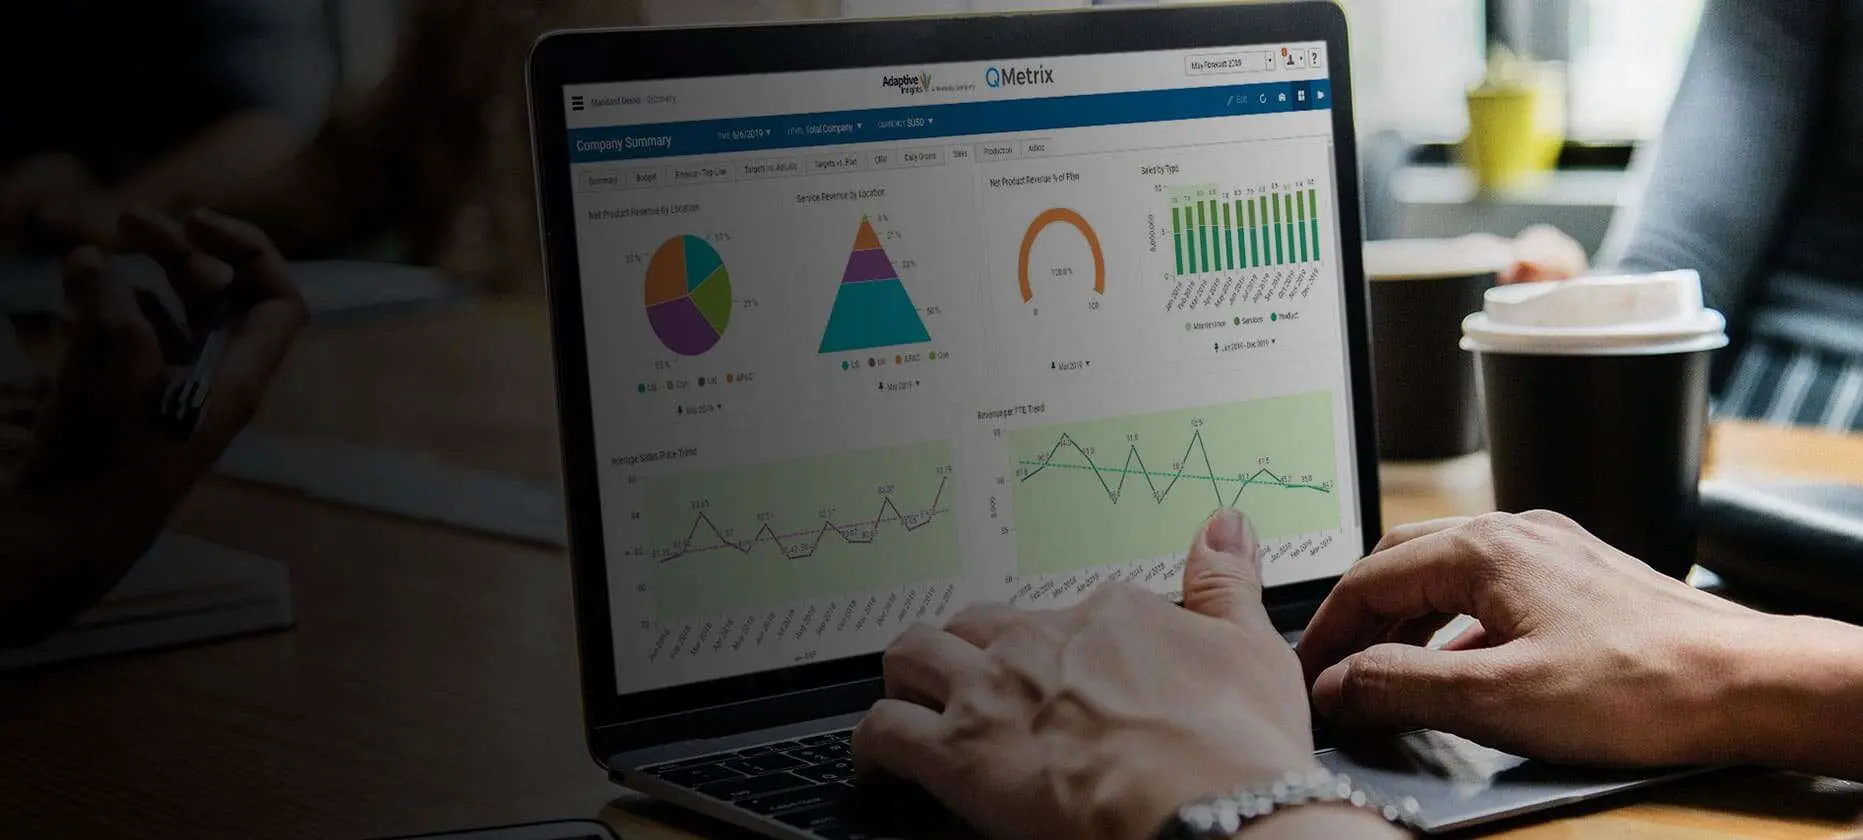
Management Reporting
and Analysis
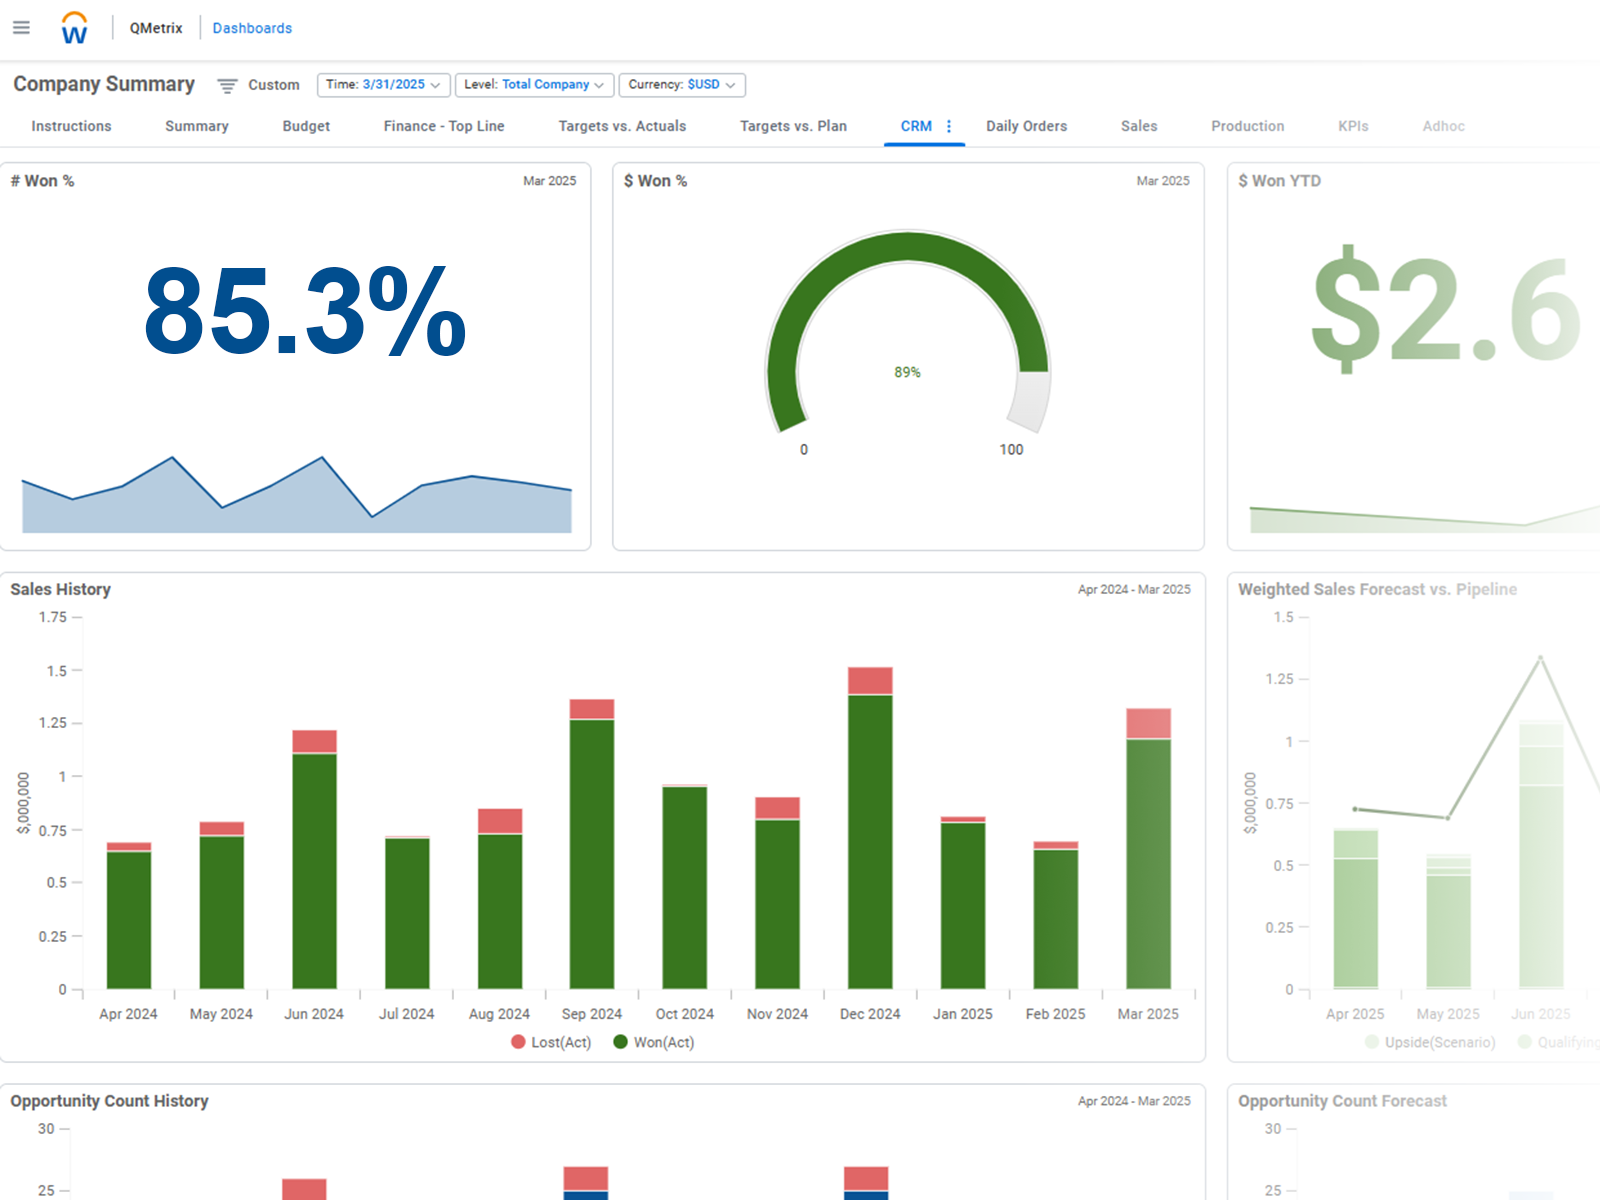
Get powerful management reporting and analysis with timely dashboards, interactive visuals and self-service insights.
Finance team members and business leaders can quickly explore data, track performance and share clear, trusted reports, driving stronger alignment across the business.
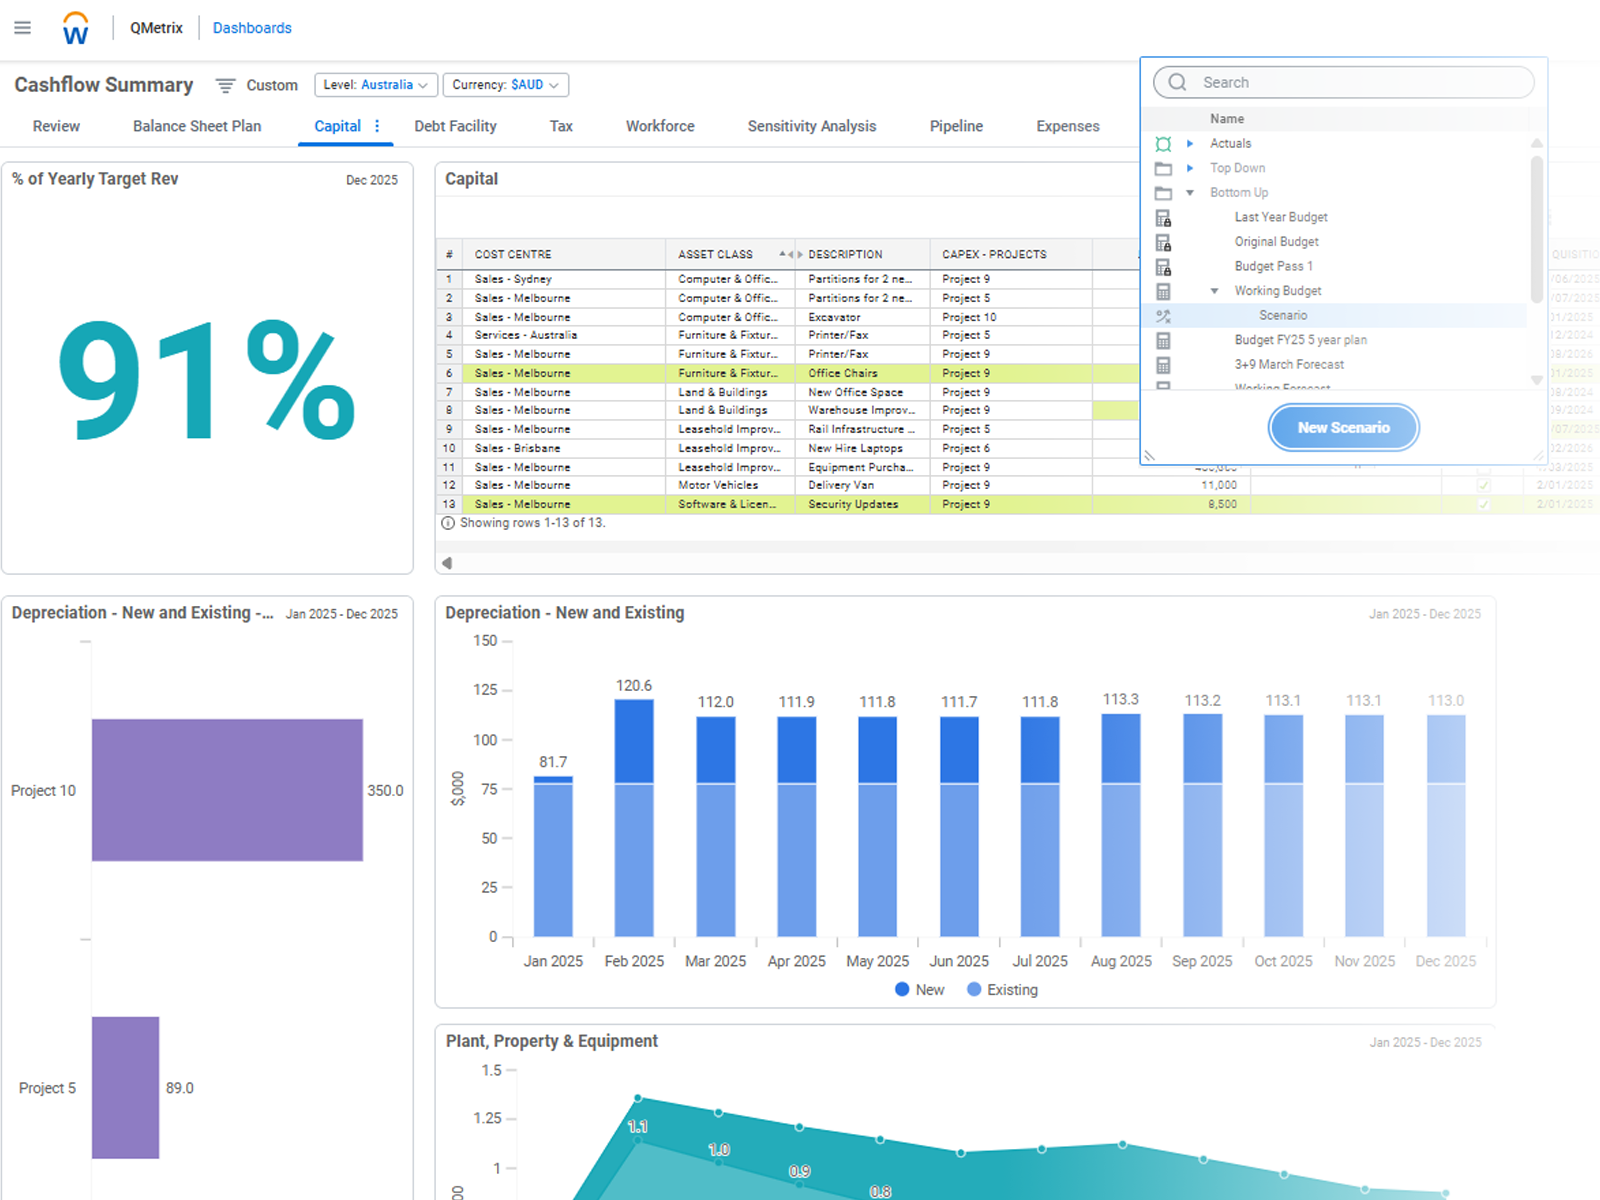
Scenario Planning
Explore rapid ‘what-if’ scenario modelling to compare assumptions, test risks and evaluate outcomes instantly.
Workday Adaptive Planning enables easy
top-down or bottom up drilling, and helps organisations plan for uncertainty and achieve greater agility in changing business conditions.
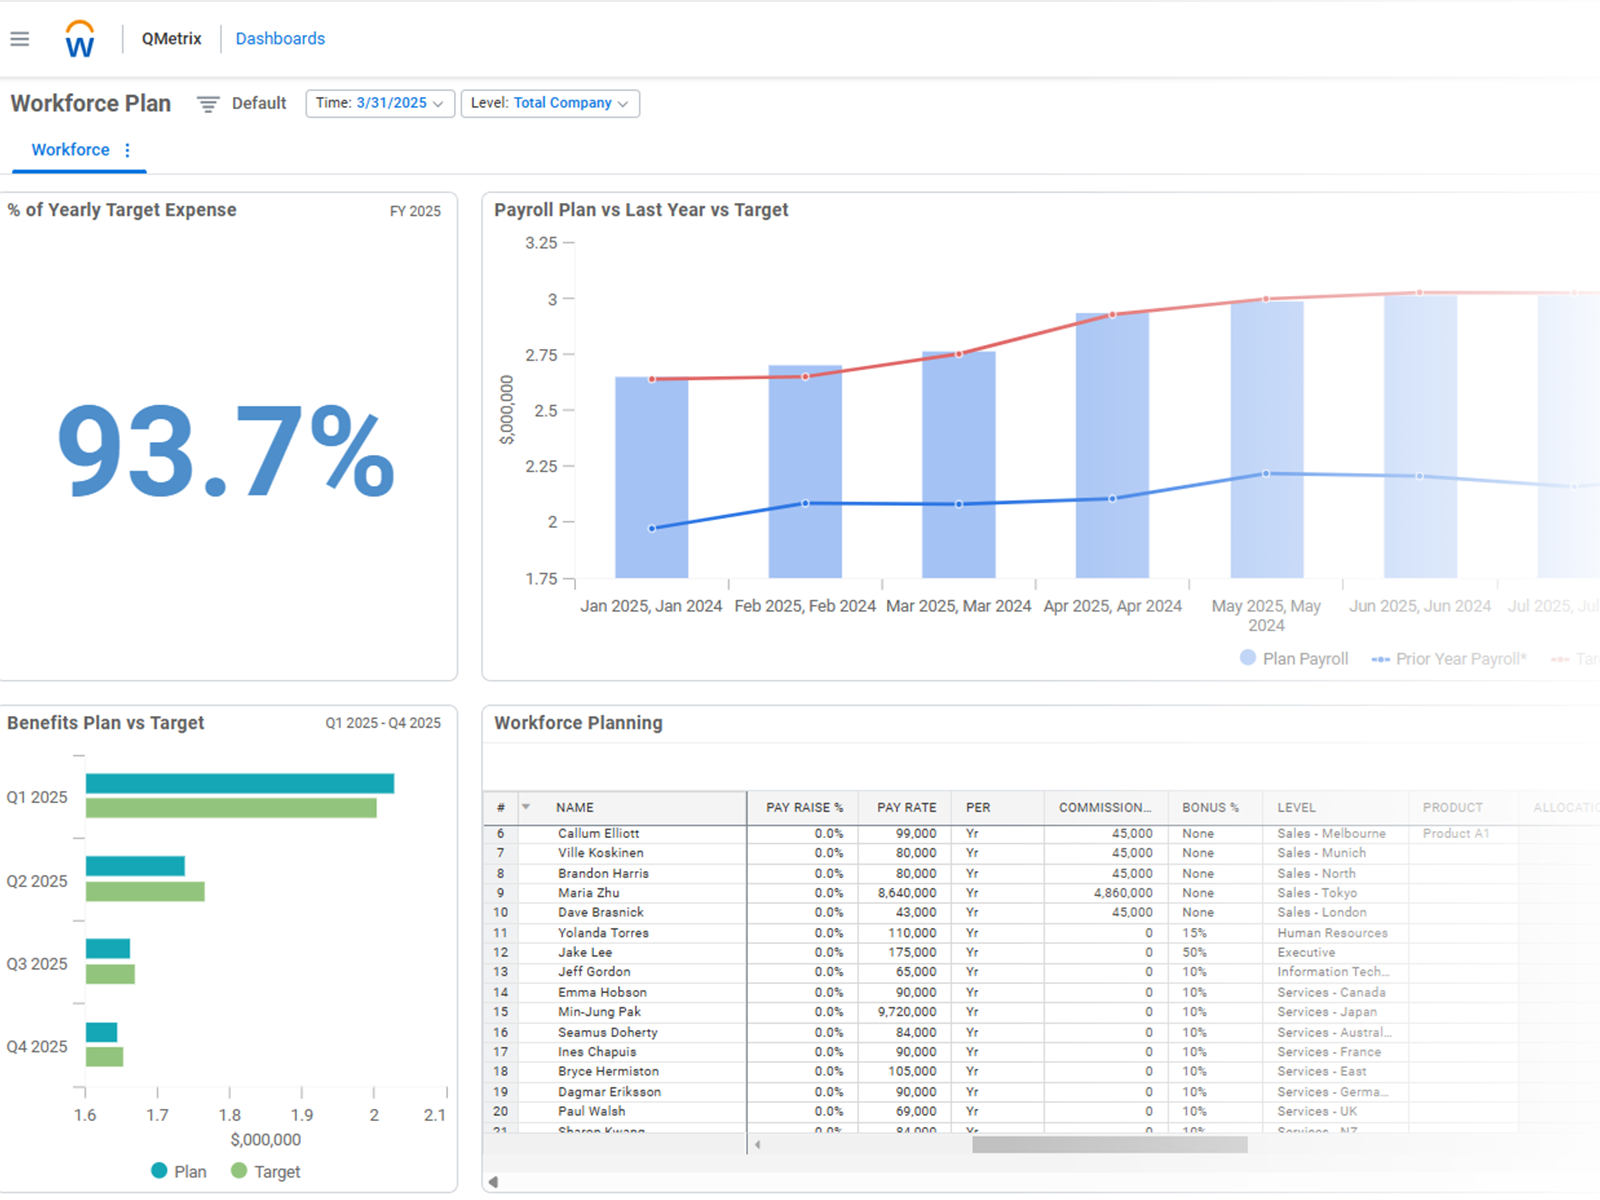
Strategic Workforce Planning
Plan for your workforce with real-time headcount, skills and cost insights – with assumptions all built into Workday Adaptive Planning.
Its flexible modelling helps organisations align talent needs to business goals, optimise staffing scenarios and plan future capacity.
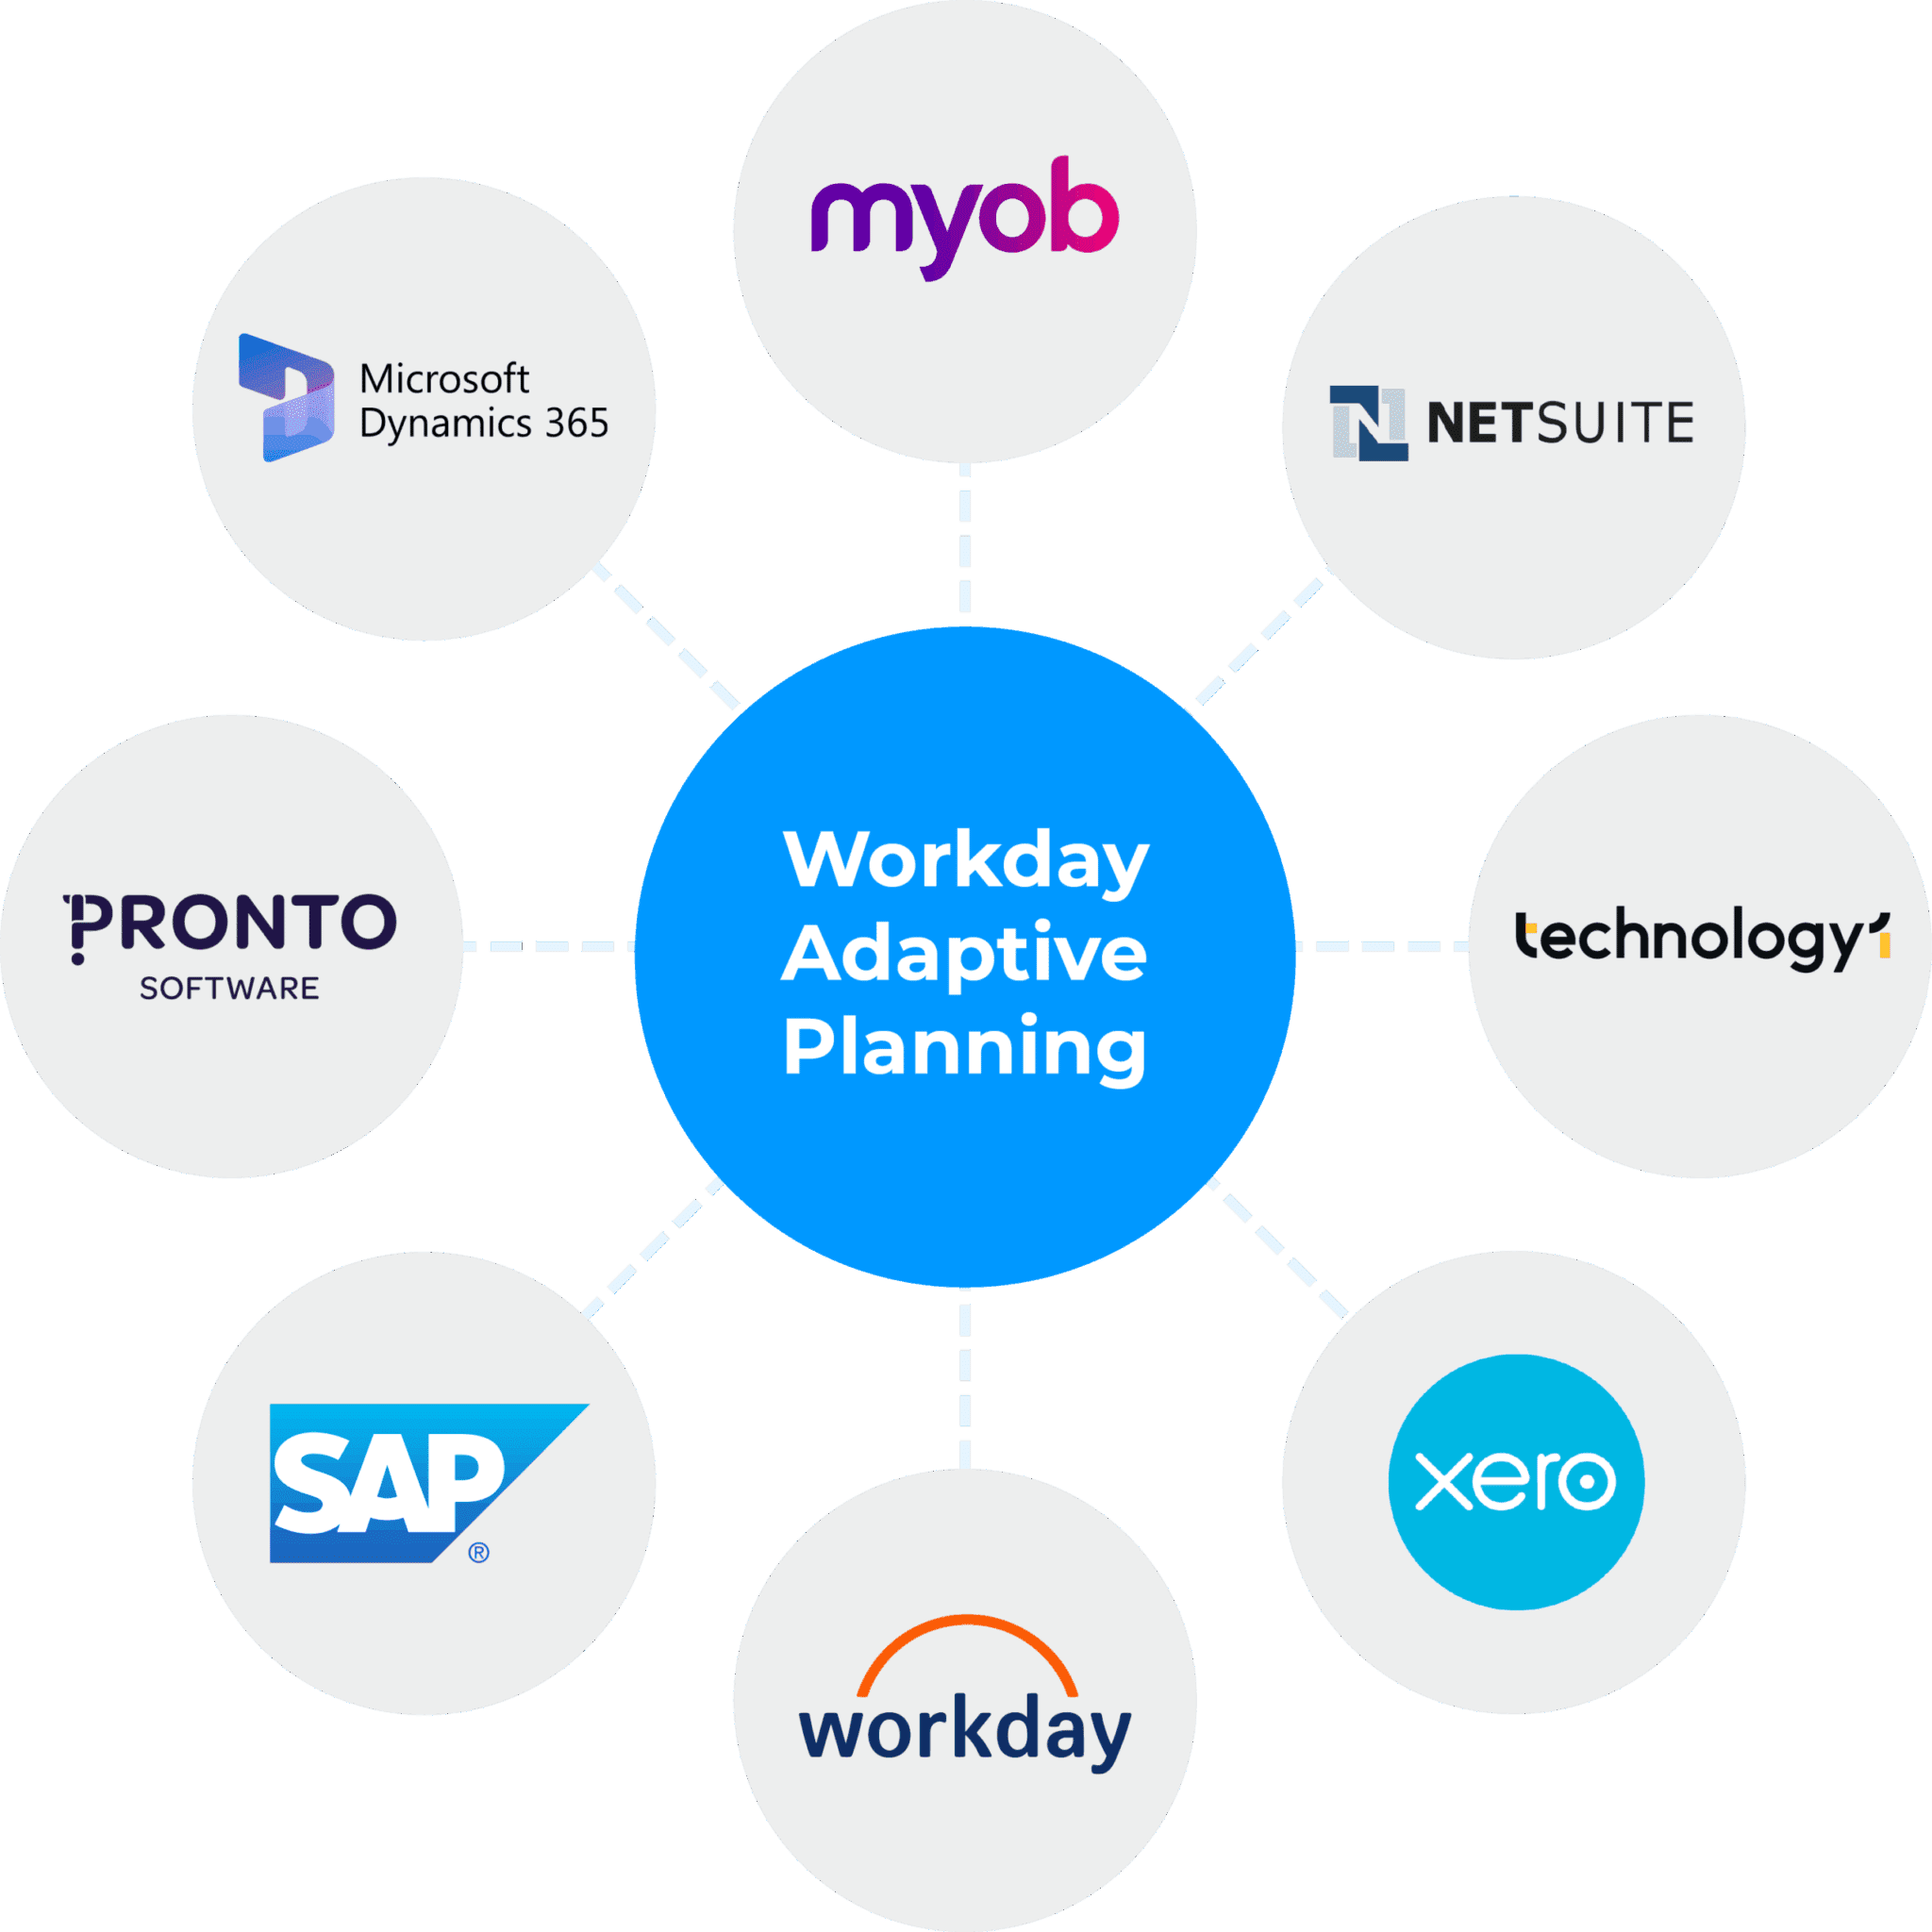
Automated data flows
Workday Adaptive Planning integrates seamlessly with your existing systems, ensuring fast, reliable data flows across finance, HR and operations.
Automated connections reduce manual work, improve accuracy and give teams timely insights – enabling more connected, efficient and informed planning. Learn more about Workday Adaptive Planning integration.

Why QMetrix
Experts in the region
QMetrix combines deep specialisation, a proven methodology, and ongoing support to ensure success with your implementation. We have been awarded by Workday Adaptive Planning as APAC Partner of the Year, in recognition of our successful implementations with clients across Australia, New Zealand and Southeast Asia.
Work with a trusted partner
We adopt a phased, consultative model focused on listening, challenging assumptions, and guaranteeing success beyond go-live.

Deep finance expertise
Our team consists of CA/CPA-qualified professionals who truly understand finance challenges and language
Collaborative
co-pilot
We work as an extension of your team, delivering immediate wins while designing a scalable, sustainable solution
Empowering ownership
We train your team to own and manage the system without having to rely on external assistance
Verified
success
Our certified consultants ensure your instance delivers business value from day one
for current adaptive users
Maximise value: Get an Adaptive Health Check
If your current Adaptive Planning instance is slow, suffers poor user uptake, or if models no longer suit your needs, our Health Check can help you.
We review your instance and provide a remediation roadmap that will set you on the path to an optimised investment in Workday Adaptive Planning.

Clients who partner with us
Workday Adaptive Planning case studies

Kinatico’s path to a more efficient and powerful Workday Adaptive Planning instance
Discover how QMetrix helped Kinatico make their Workday Adaptive Planning instance more efficient and powerful.

On the right track: FP&A transformation in rail freight with SCT Logistics
Here’s how SCT is driving FP&A transformation in rail freight logistics with QMetrix and Workday Adaptive Planning.

cohealth: A not-for-profit getting the right financial and business insights
To complement Microsoft Business Central, not-for-profit cohealth brought in Workday Adaptive Planning. Learn how it changed budgeting, forecasting and reporting at cohealth.

How Tennis Australia integrated financial and strategic planning
Learn how Tennis Australia achieved an integrated budgeting, forecasting and reporting solution and wider business goals with Workday Adaptive Planning.

A win for the Slater and Gordon finance team
Discover how Slater and Gordon got more business partnering and value-add with QMetrix and Workday Adaptive Planning.

Re-energising Financial Planning and Analysis with Red Energy
Learn how Red Energy powered up their finance and commercial teams, as well as the wider business utilising Workday Adaptive Planning.

Fashioning a suitable FP&A solution for Designworks
Learn how Designworks changed their Financial Planning and Analysis process to one that is smoother, cleaner, easier, more accurate and more insightful.

Integria Healthcare achieves better planning through Workday Adaptive Planning
Learn how Integria Healthcare replaced 40+ manual spreadsheets with Workday Adaptive Planning to streamline global budgeting and scenario planning.

Infinite Care, infinite possibilities with Workday Adaptive Planning
Learn how Australian residential aged care provider Infinite Care implemented Workday Adaptive Planning to enhance their budgeting, forecasting and planning.

Small team, big results: How this global tech company levelled up their FP&A
See how a global tech company moved from manual Excel to Workday Adaptive Planning with QMetrix to automate reporting and scale FP&A.

No more finance blues for Beyond Blue
Learn how Beyond Blue achieved a simplified and streamlined budgeting, forecasting and reporting process, and quicker decision making across the organisation with Workday Adaptive Planning.

Douglas Partners: From number crunchers, to business partners
Workday Adaptive Planning enabled Douglas Partners’ finance team to reduce manual work and increase their capacity to bring greater value-add for the business.
Royans case study: A game changing financial planning system
Discover how FP&A at Royans changed when they brought Workday Adaptive Planning on board. Watch the interview with Cindy Gregory, CFO at Royans.

Maximising mission impact with Save the Children
Learn how Save the Children transformed financials and maximised their mission impact with Workday Adaptive Planning.

TGI Sport case study: Connecting sport brands, fans and financial plans
TGI Sport went from spending time compiling data to focusing on analysis and strategy, thanks to a tool that enables them to efficiently manage global operations and drive performance.

Ventura Bus Lines case study: Transporting the team to planning utopia
Learn how Ventura Bus Lines worked with QMetrix to bring an underperforming Workday Adaptive Planning instance to one that is now seamless, fast, accurate, and easier to use.

RACS case study: Operating with real-time insight and precision
Outdated applications, lack of support, a static budget and error-prone spreadsheets were a part of the Royal Australasian College of Surgeons’ budgeting and planning process. Learn how they changed this with Adaptive Insights.

SACA case study: Batting for rolling forecast success
SACA wanted to move from an error prone annual budget to a rolling forecast. Learn how they achieved their goals with the budgeting and planning solution, Adaptive Insights.

TasWater case study: How Tasmania’s water authority sped up their budget cycle by 10x
TasWater needed faster budget cycle completion times. Learn how QMetrix worked with them to speed it up by 10x with Workday Adaptive Planning.

Fonda case study: From 30 messy spreadsheets to 100% accuracy in just 6 weeks
Fonda needed new capability for consolidating, reporting, budgeting, forecast and financial modelling. Learn how they did this in just 6 weeks with Adaptive Insights.

Modernising financial and strategic planning with Australian retailer Bevilles
Bevilles transformed their financial processes with Adaptive Planning replacing messy Excel spreadsheets, achieving automated data integration, and store-level reporting for better strategy.

Trilogy Funds case study: Investing in the right planning solution
Learn how Workday Adaptive Planning enabled Trilogy Funds to better manage their loans, forecast, report and make data-backed decisions.

RACGP case study: Improving the health and wellbeing of the budgeting and planning process
Not-for-profit organisation, RACGP, made the shift from a legacy budgeting tool to a cloud-based budgeting and planning solution to achieve their goals. Learn how in this case study.

MessageMedia case study: Getting the message out there – Workday Adaptive Planning is a game changer
Learn how MessageMedia moved from Excel spreadsheets to an easy, powerful and fast budgeting and planning system that was a “game changer”.

SACA use case: Board Reporting with Workday Adaptive Planning OfficeConnect
The South Australian Cricket Association used Adaptive Insights OfficeConnect to create their monthly reporting pack. Walk through their process from scoping to getting buy-in and implementation.
Workday Adaptive Planning
Resources & Articles
Featuring quick Workday Adaptive Planning tips, tutorials, videos, release updates and more. Explore them and level up your knowledge of Workday Adaptive Planning here.

Workday Adaptive Planning 2026 R1 Release Review
Workday Adaptive Planning’s first major update for 2026 focuses on 3 key areas: scaling, streamlining and security enhancements. Read our breakdown of each.

Workday Adaptive Planning 2025 R2 Release Review
Workday Adaptive Planning have just released new features and it’s all about making planning more intuitive. Read about the features here.

Predictive Forecasting in Workday Adaptive Planning
Want to use AI to forecast? See how you can apply predictive algorithms to real-world planning scenarios in Workday Adaptive Planning.

How to use Workday Adaptive Planning OfficeConnect in Word and PowerPoint
Learn how to enhance reporting workflows by integrating OfficeConnect with Microsoft Word and PowerPoint – especially useful when recurring reports like monthly executive summaries or board presentations.

Workday Adaptive Planning 2025R1 release – what’s new
The 2025R1 release introduces a range of powerful features designed to enhance collaboration and simplify reporting, including reports in dashboards, burst reporting, and the ability to share scenarios.

Insights for finance leaders in Health and Aged Care
We discuss what financial management and strategic planning looks like for health and aged care organisations, alongside CFOs of Infinite Care and ECH, Zane Ali and Merrin Nancarrow.
QMetrix is 2025 APAC Workday Adaptive Planning Partner of the Year
QMetrix has been named Workday Adaptive Planning Partner of the Year in the region for the second time.
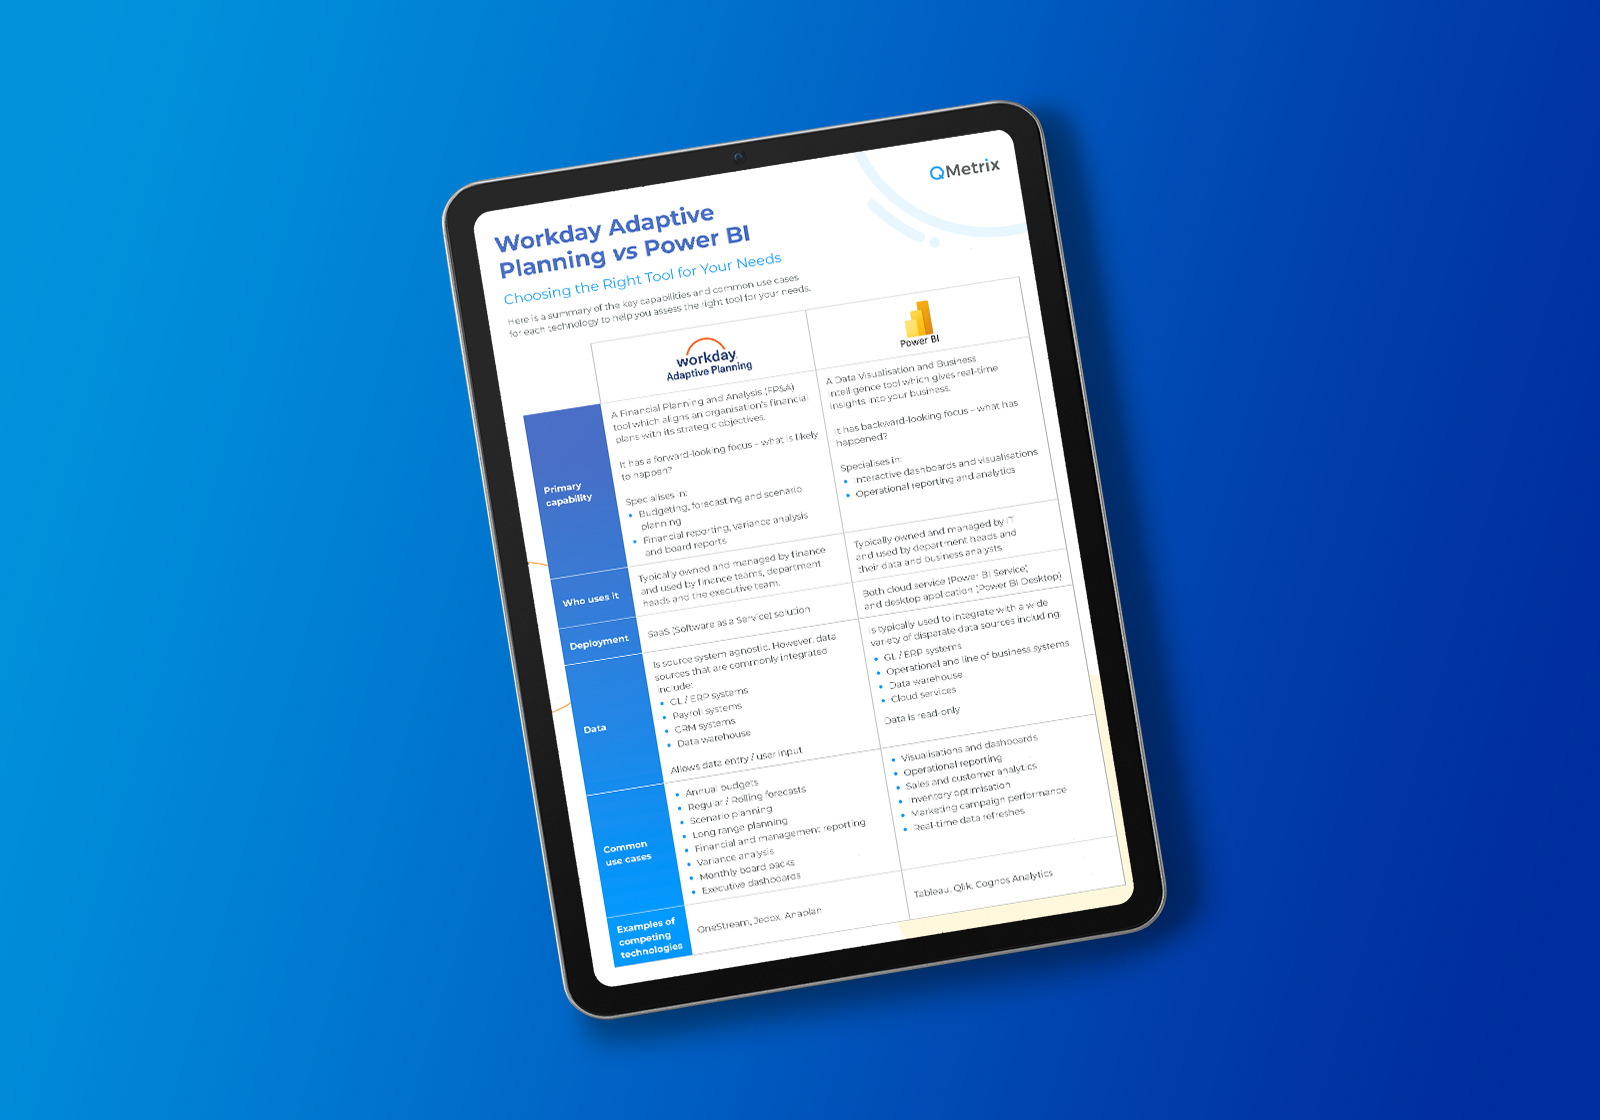
Workday Adaptive Planning vs Power BI: Choosing the right tool for your needs
Do you need Workday Adaptive Planning if you already use Power BI? While both tools are powerful, they serve different purposes in an organisational setting.

Workday Adaptive Planning Release 2025 R1 Release Review
Discover the Workday Adaptive Planning 2025 R1 new features: Shared Scenarios, Matrix Reports on Dashboards, and enhanced data validation rules.
Maximising FP&A Potential – Tips for Cloud-Based ERP Users
Are you using Microsoft Dynamics 365 ERP or another cloud-based ERP? Learn how you can get more from your Financial Planning and Analysis capability in this video.
FAQs about Workday Adaptive Planning
Quick answers to common queries about Workday Adaptive Planning, implementation and our partnership.
Workday Adaptive Planning is a cloud-based Financial Planning and Analysis software which provides budgeting, forecasting, planning and reporting capabilities. The toolset is intuitive and designed for finance teams and business users to plan effectively, visualise performance and monitor results. It was formerly known as Adaptive Insights, and is now part of the Workday suite of products.
Workday Adaptive Planning has a proven track record of driving efficient and effective planning solutions for 7,000+ businesses worldwide across a wide array of industries. It has been recognised as a 2023, 2024 and 2025 Garner’s Customer’s Choice for Planning Software. Speak to us to discuss if Workday Adaptive Planning will be the right fit for your organisation’s current needs.
External consultants can help you get started by implementing and building initial models. At QMetrix, we build models to best practice and provide training to equip finance teams to own and manage the models going forward. Workday Adaptive Planning is ultimately designed to be owned, managed and maintained by everyday business users and has been recognised industry-wide for being intuitive for administrators, power users and end users.
At QMetrix, our team is made up of experienced finance qualified consultants (CA/CPA) who understand first-hand the pain of going through manual budgeting and forecasting cycles. We are also backed by in-house data specialists who step in for data related challenges. Importantly, we specialise in Workday Adaptive Planning and have been recognised by Workday as APAC Partner of the Year in 2024, 2025 and 2026.
QMetrix has implemented Workday Adaptive Planning for more than 100 finance teams and have a proven methodology that works. We don’t just take your existing spreadsheets and replicate them; instead we partner with you to enhance models according to business needs and best practice. We will ensure the Adaptive Planning suite is optimised to drive the most value for your organisation.
Workday Adaptive Planning is licensed annually based on the number of users and overall size of the company. This makes it affordable for smaller enterprises and can be scaled up or down to suit the changing needs of the business. As a cloud solution, there are no hidden infrastructure costs to worry about. Read our guide on FP&A tools including a rough cost guide here.
Implementation time can vary. For our prepackaged offering, deployment can be completed in as little as 4 weeks – learn about our Plan to Thrive implementation packages. A more customised deployment can take from 8 to 10 weeks.