Cognos Analytics was first released in late 2015. Since then, there have been frequent releases with the addition of new exciting features and fixes.
The first thing a previous Cognos user would notice when logging into Cognos Analytics is that IBM has replaced the outdated interface first seen in the early 2000’s with a modern and fresh user interface.
The old interface had long been perceived as hard to navigate and far from the look and feel of other modern applications. In contrast, the new version emphasises on self-service and user experience, while still delivering the strong “nuts and bolts” business intelligence (BI) capability for which it is well renowned.
The rebranding of Cognos 10 to Cognos Analytics is more than just a mere name change and provides a clear direction for where IBM is looking to take this product in the future.
What’s new in Cognos Analytics
In Cognos Analytics there have been upgrades to the interface, themes and extensions, reporting, data modules, data sets and dashboard. Let’s explore these features.
Interface
- A brand new layout with context sensitive menus make it easy to identify the folder structure and report path.
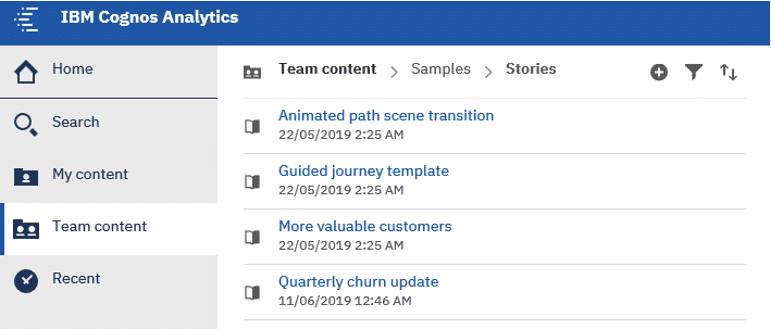
- Search suggestions provide an intuitive and user-friendly experience. Results of searches include descriptive report paths, column names and meta data.
- Users can now ‘subscribe’ to reports and access them conveniently in ‘My Schedules and Subscriptions’, whilst also receiving ‘Notification’ alerts when changes to the subscribed reports are made.
- ‘My Schedules and Subscriptions’ can be accessed from the home page, allowing easy monitoring of all jobs/schedules and subscriptions.
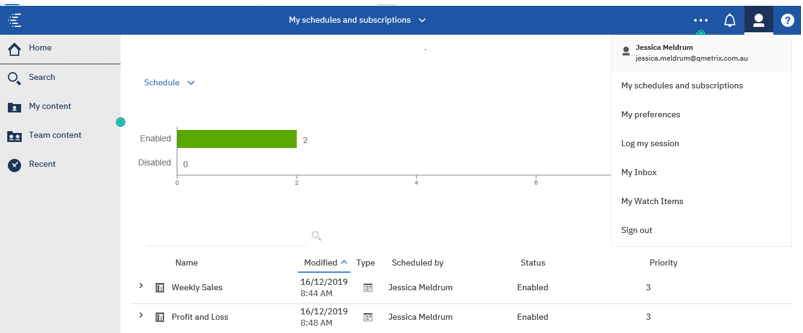
- Review reports that you have recently accessed on the main welcome screen or through your recent folder.
- Side panels improve navigation and enable consistent mobile and web interactions.
Themes and extensions
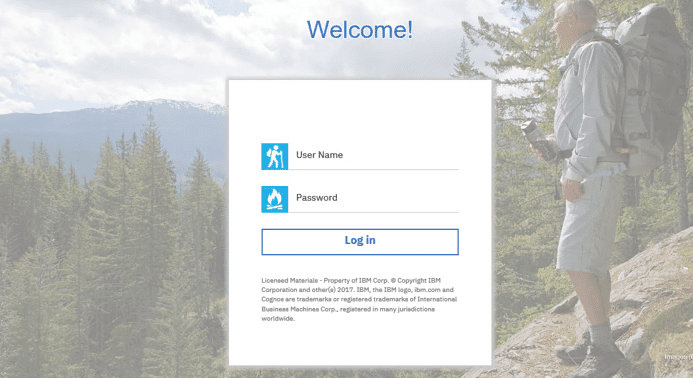
- Themes and extensions allow for greater customisation of the Cognos Analytics portal. Extensions can be installed to change the colours and background of the interface and tailor it towards the end user. Icons and features can be hidden to remove any unnecessary noise to the portal and provide a sleek, user friendly interface.
- In the screenshot below, see how an extension has been used to change the background to an image.
Reporting
- Reporting has been redesigned, with the rebranding of Report Studio to Report Author. Report Author combines Report Studio, Query Studio and parts of Workspace Advanced into one master reporting tool with all functionality transferred across. This makes the development of both simple ad-hoc reports and more complicated and comprehensive reports more manageable. The ability to change the reporting view between ‘page design’ and ‘page preview’ mode allows for efficient on-the-spot analysis and data validation without having to run the entire report.
- You can now report from multiple packages within the one report. Whilst a query can only reference one package, a report can contain multiple queries each referencing different packages, allowing for comprehensive analysis across multiple sources.
- External files (.xls, .xlsx and .csv) can be uploaded and reported against to supplement other data sources.
- Interactive reports allow drill, sort and filters to be added at runtime, affecting all objects in the report.
- Report templates can integrate corporate branding through headers, logos, colours and formatting. Users can create a new report using the template to automatically pick up the corporate theming and to provide consistency across the reports developed.
Data modules
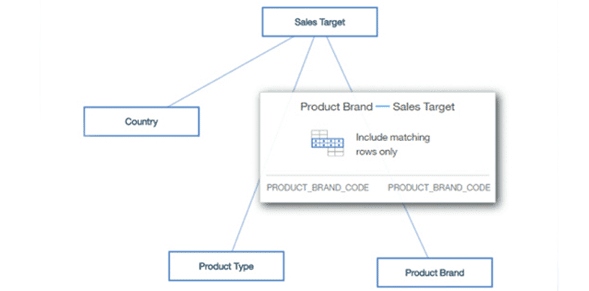
Data modules are a new and simple way of creating lightweight models to do ad-hoc reporting. They are intended for users with limited knowledge of modelling techniques and data sources.
New features in Cognos Analytics include easy upload of flat files and integration with existing relational data sources/servers to produce data modules. This feature is similar in use to Framework Manager. However, it empowers business users to make quicker decisions and forgoes heavy dependence on IT developers.
Several data sources can be integrated to produce a data module while basic joins, calculations and cardinality can be set.
Data sets
Data sets have been introduced in Cognos Analytics to enhance performance and reduce the impact on the data base by keeping a cached set of data. These can be created from either Framework Manager packages or from data modules. Data sets can be stored externally and can be set up to refresh based off a schedule.
Dashboards
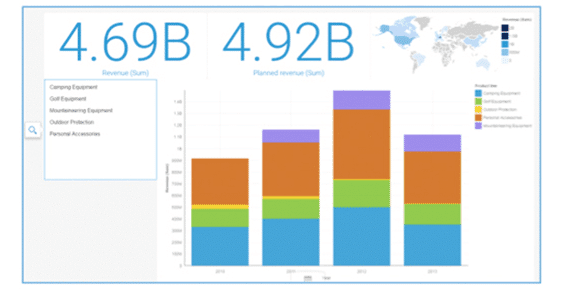
Possibly one of the most exciting features in Cognos Analytics is the dashboarding functionality. With minimal report authoring experience, users can build simple yet effective dashboards. An interesting point to note is that Cognos itself will recommend best visualisations for the data items that are dragged into the dashboard.
Templates and grids further enhance the user experience by making it easier to format and change the size of charts. Images, videos and infographics can also be added to dashboards to increase visual appeal.
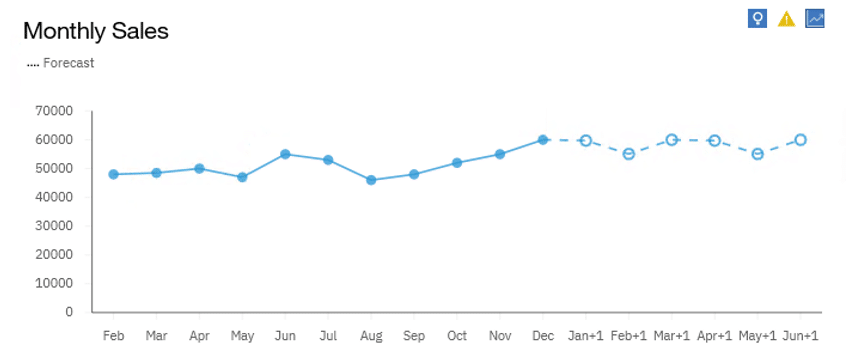
A recent inclusion in Cognos Analytics Dashboarding is the ability to generate a forecast. Cognos will capture the x and y axis of a visualisation and predict the forecast for a determined number of periods. The forecast of 6 months can be seen below as an extension of the trend line.
Data exploration
Explore in Cognos Analytics allows for context driven data discovery and exploration. When creating an exploration, analytical insights and recommendations appear on the screen to help dive deep into data discovery. Explorations can be created on an ad-hoc basis from the beginning, or visualisations from existing dashboards can be copied across.
Watch this video for an introduction of how Cognos Analytics 11.1 is a smarter generation of business intelligence.
What stays the same in Cognos Analytics
The core reporting engine remains unchanged, with an addition of a new ‘Watson-like’ engine for dashboarding, including guided data discovery, automated predictive analytics, and cognitive capabilities such as natural language dialogue.
Key functionality of Report Studio and Workspace Advanced have been combined and rebranded as ‘authoring’. It has retained all the same functionalities – but has been powered up with additional features as mentioned above. The new placement of the various panes can take a little getting used to, but they are much more user friendly then previous versions.
Final verdict on Cognos Analytics
The later versions in Cognos Analytics (11.1 and beyond) have provided a single interface for data integration, modelling and report creation, thus simplifying the analytics development process.
An integrated solution eliminates having to work across different studios and provides greater security and governance. As one solution across mobile and web platforms, Cognos Analytics increases efficiency and provides a consistent user experience.
With this release, the focus has been a completely web-based experience with the addition of visual appeal and ease of use. Engaging and intuitive visualisations with an updated interface add to the user experience, keeping it in line with Watson Analytics.
Since its initial release in 2015 IBM has made several upgrades, improving Cognos Analytics’ functionality as a more efficient self-service tool while keeping its powerful development and robust reporting features. You can check out the latest Cognos Analytics release notes here.
From our use of the new release, we have seen first-hand how Cognos Analytics has delivered a better experience for our clients. It provides a simpler and more effective way to visualise, analyse and share business insights. If you are on the old version, it is well worth an upgrade.
If you are an existing Cognos user who is considering an upgrade to Cognos Analytics, QMetrix are certified Cognos Analytics partners – we’d be happy to chat.


