Introduction
In preparing management accounts, it is usual for forward dated transactions to be for fixed amounts on fixed dates. For medium term forecasts, the “date” may be a month, but there is no provision for expressing the uncertainty with which a given event will occur.
We propose a system for enabling future events to be represented by a distribution in time, with provision for possible split payments as an additional option. As the merit of a system is in its ability to guide management with transparent and consistent data, we have deferred implementation of generally variable transactions amounts until we settle on a suitable presentation format for the system outputs.
The first deployment of these Statistical Journals (“SJ”s) is in support of our companion offering Impaired Receivables (“IR”) which mitigates losses incurred during trading with a customer who has, or might, become delinquent.
For clarity, this paper will refer to the IR product for illustrative purposes.
Profiling receivables
Refer to Appendix 1.
This pattern of receivables shows both the traditional forecast and a corresponding statistical forecast. The comparison graph of the two sets of transactions shows their aggregation (cumulative receipts). In this case, the statistical transactions are separated by time, so there are catch-up points where the graphs touch (being time periods when aggregate receipts are identical). In a commercial IR forecast, it is unlikely that such gaps in time between transactions would exist. This is very material in determining both the internal accumulators, and their external (user) representation.
The 2-dimensional profile
For output to paper or a simple line graph on the computer screen, a cumulative total receipts on the y-axis versus date on the x-axis is the best representation for ease of use by the manager.
There are three major considerations here:
- The non-statistical individual transactions are always available for review (as per the example), and will be recorded as customer payments in the accounting system as the forecast receipts become actual (or show in an aged debtor display).
- In the IR scenario, the joint risk metric is determined in part by cumulative receipts, and partly by the nature of the originating supply (running account or occurring during the relation-back period). The latter is predicted by reference to forecasts, but awaits crystallization of the receipt to determine its status.
- Where a transaction is predicted to occur on one of several dates, it cannot be represented on a simple timeline as a discrete whole amount, since this would distort the view of out-standings. (A $100 payment might occur 6 times, for example.) Instead, the various probabilistic date-amount items need to spread across to a third z-axis. See Appendix 2 for a simple example.
The 3-dimensional profile
In probability, if a discrete event can occur in one of, say, 5 ways (such as date), and the next event in, say, six ways, then there is a total of 5 x 6 = 30 joint outcomes. Extending this concept to even a modest 100 probabilistic transactions, there would be, say, 5100 possible outcomes. Clearly this is infeasible to compute or represent to the user.
The individual probabilistic transactions can clearly be reviewed from the input spread-sheet. Their representation on a 3-D graph can, however, aid assimilation of the overall forecast. However the representation of all possible cumulative receipts is, as just shown, infeasible.
See Appendix 3 for an example of a 3-D representation of 10 transactions, where the transactions have been presented in the day~likelihood position (x~y axes) at their face value. The complexity of drilling down to find constituent transactions, and their attributes, is dealt with conveniently by packages such as IBM Cognos Express Xcelerator.
Note: the graphical output of Excel, whilst excellent, is not optimal for viewing the 3-D graph of a real-life scenario. We are investigating alternatives, including the widely acclaimed TableauTM from Stanford University, to allow aerial navigation over the 3D chart.
Related party Risk / Reward metric (“RRR”)
Refer to our Appendix 4 for the introduction to our IR paper.
When maintaining the overall exposure to a customer of the supplier in the IR scenario, we are reminded of the rules for equity accounting a majority-owned subsidiary company.
For exposed transactions (those subject to claw-back by a liquidator), a payment by the customer to the supplier must be offset by an increase in the provision for loss (after liquidation) by an amount which reflects the proving ability of the supplier versus the aggregate provable debt of other suppliers to the customer. In essence, if the supplier is a dominant cost to the customer, the supplier can expect a meaningful percentage return on his proven debt in the liquidation. Under certain circumstances (largely related to the supplier’s knowledge of the customer’s state of affairs), the effluxion of time will cause a decrease in the provision, as the relation-back period moves forward in time.
Thus, a payment by the customer to the supplier only partly reduces the exposure, but has a contingent reward of full reduction in time.
Likewise, a further supply to the customer will usually (provided it is not a wasting supply) not correspond to a like increase in exposure, as the customer both increases its balance sheet to the (partial) extent of supply, and reduces its debt to the extent of any payment as above.
The main legal and trading devices to mitigate the supplier’s risk – Romalpa clauses, PPSA securities, securities over real property, running account trading and pre-payments must also be considered when determining the exposure and contingent reward.
It should be noted, that aside from any allegation of insolvent trading, the P&L is quite subordinate to the post-administration BS in determining the ultimate outcome for the supplier. Pivotal in determining the outcome is the effective date of insolvency which may be the subject of proceedings in the event a large creditor is adversely affected by the liquidator’s findings in this regard. This can occur even during profitable trading, and with a positive BS.
The relevance of the SJ to the RRR is obvious – when considering an overall or isolated course of action, the supplier must be guided by the ongoing net statistical effect on his BS and, immediately, on his current account, of his further dealings with the customer.
Appendix 1 – Statistical Profile of Journal Entries
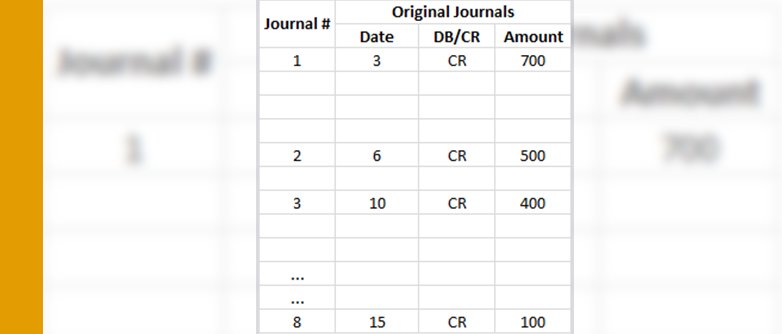
The table below is a set of receipt transactions expected to arrive on Days 3,6 and 10.
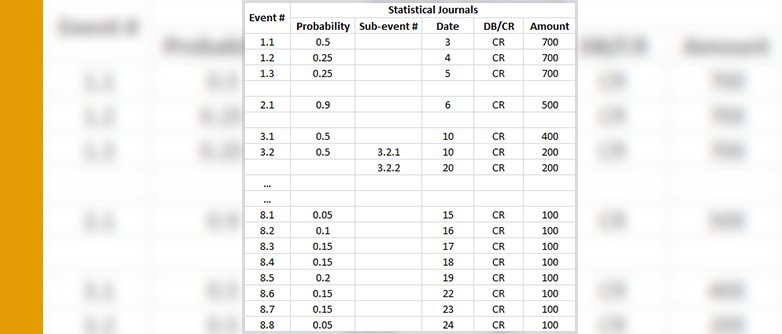
The table below is the same set of receipts, where the operator has specified an uncertainty as to date, by assigning a statistical distribution type to each transaction. Note: the distributions are not traditional (Normal, Poisson etc) but reflect the operational experience of the operator. There is no tail, the distribution can be multi-modal, exhibit pronounced skew or kertosis, and may sum to less than 1 (a finite chance the transaction will not occur).
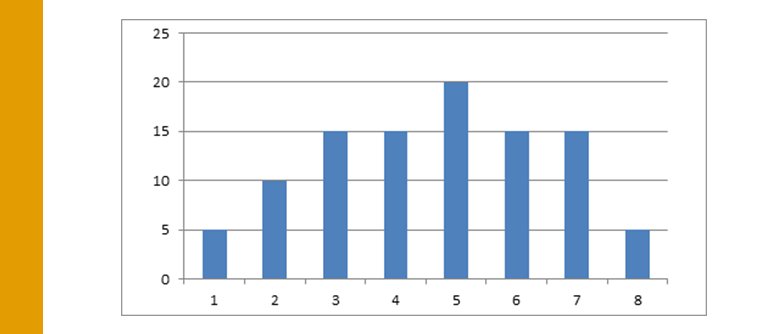
The graph above is the distribution of event 8 – a library of parameterised distributions is available to the operator to facilitate data entry.
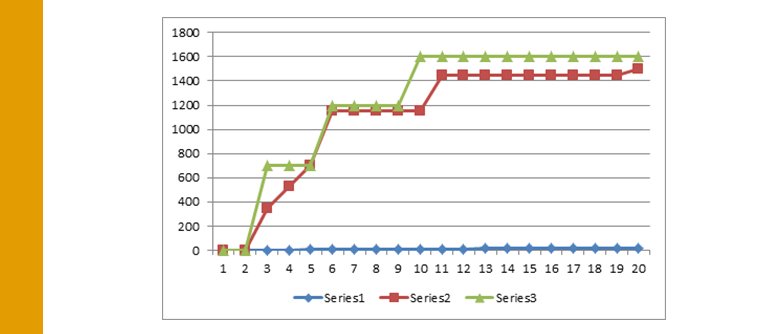
The graph above is a Comparison of Cumulative Value of Original and Statistical Entries
- The green curve is the chart of original transactions.
- The red curve fails to reach the same cumulative value due to uncertainty of transaction # 2.
Appendix 2 Simple 3-D Line Chart for Non-overlapping Probabilistic Journal Entries
A sequence of CR, DB then CR.
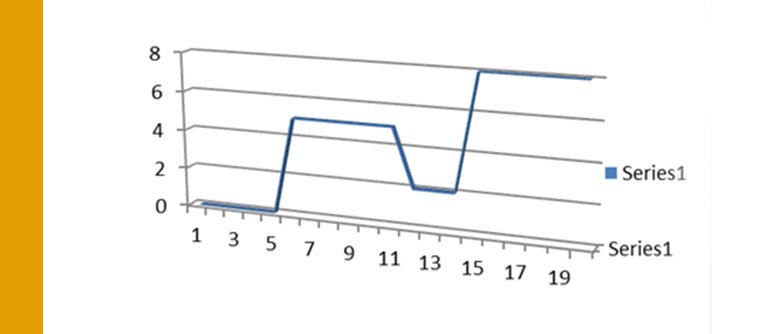
The above graph is the original forecast.
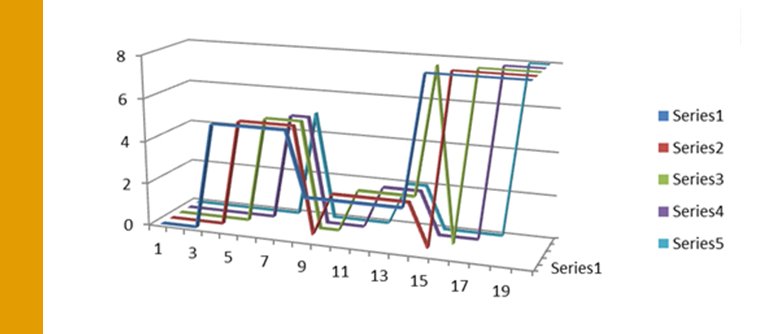
The above graph shows the statistically modified forecast.
Note that although there are only 3 well-spaced transactions, the statistical forecast chart is already quite dense with lines, and difficult to assimilate visually.
Appendix 3 3-D representation of 10 transactions
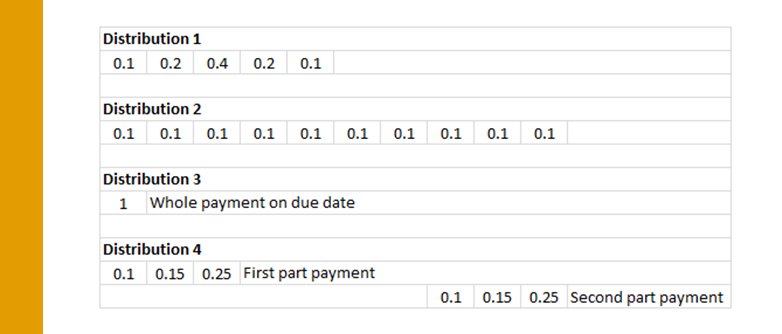
This is a reference table of the distributions used in this example.
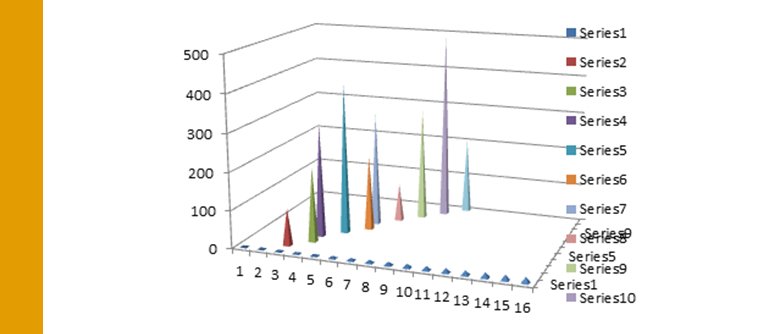
Original Pattern of Entries
This is a set of receipt transactions, forecast to occur over 2 weeks.
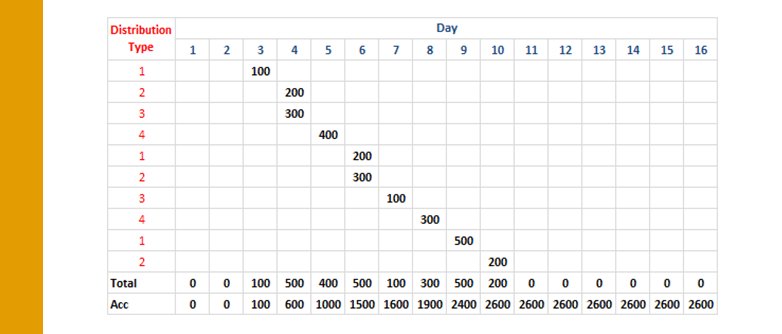
Statistical Pattern of Entries
This is the same set of transactions, distributed according to the rules above.

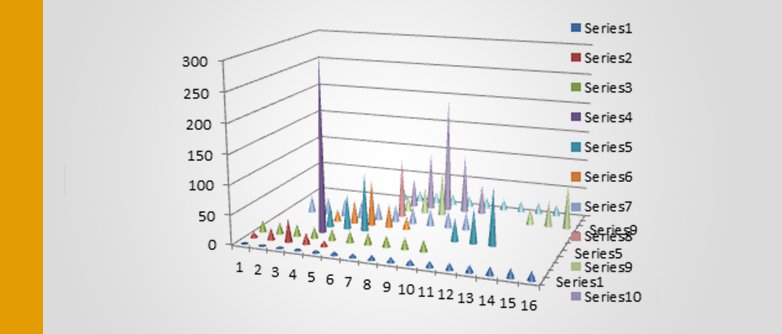
The above graph of risk-weighted receipts, whilst correctly identifying the contributing values, does not give a clear picture of the cumulative total, which, for RRR purposes, is as important as the individual transactions (which must be evaluated for claw-back exposure).
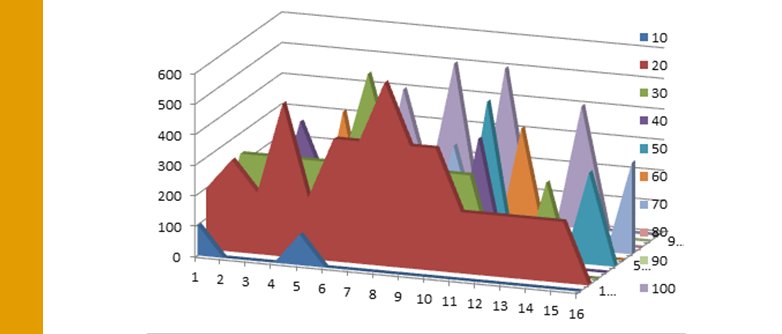
The above chart shows total face-value receipts in an array of day~risk.
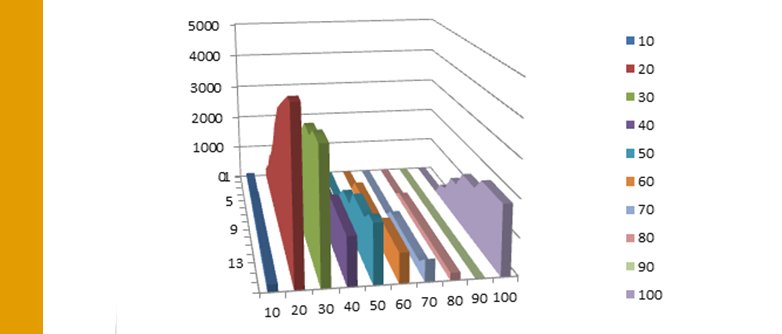
The above chart is the cumulative version of receipts on a day~risk array.
The charting already indicates the difficulty of creating a visually intuitive view of the statistical journals.
With a commercially realistic transactions during the forecast period (probably 3 months) being mixed debits and credits numbering in the hundreds, it is apparent that communicating the data held internally in the system will be a major factor in the willingness of clients to deploy this solution. What-if scenarios must be easy to activate and visualise to aid real-time decision-making by management.
Appendix 4 – Impaired Receivables scenario
The Scenario
ACE Construction Services Pty Ltd (“ACE”) is a medium sized player in the commercial building industry. Its turnover is between $130M and $150M per annum. Over half of its work is fixed price projects in the range of $10M to $50M, sometimes spanning several years, from the commencement of tendering until final recovery of retention monies.
It has a loosely connected panel of preferred labour and materials suppliers, whose terms of trade are generally piecework and 30 days terms respectively. ACE has a fixed staff of 90 administration, estimating and project management personnel, and leases its office and warehouse facilities on long-term commercial terms.
ACE has sought insurance for defaulting debtors, but has not been successful in obtaining premium quotes that are consistent with its operating margins. It has a bank facility split between fully drawn loans and an overdraft, secured by a floating charge over its assets, including its receivables. The lender receives monthly financial statements. Recently, the overdraft has moved from fully fluctuating to a hard core of debt, which is currently the subject of discussions with the bank which is seeking to roll the core overdraft debt into a term facility. Without sufficient additional assets to secure the new facility, the bank has discussed other options, including board guarantees.
In summary, ACE is a privately held SME in a volatile industry, with razor-thin margins, and a deteriorating balance sheet.
The Problem
One of ACE’s customers is a developer, Ephemeral Pty Ltd, which has commenced several office and estate developments, two of which involve substantial work by ACE. For almost a year, payments by Ephemeral are made in strict accordance with the agreed terms of supply, as ACE is not in a position to extend trading terms, due to its own financial situation. (In fact, regardless of its financial strength, every company should question the efficacy of extending its terms of trade, merely to promote a warm relationship with a customer.)
Unknown to ACE, Ephemeral has been struggling to achieve its pre-commitment schedule on an estate, and is moving closer to default of its facility with its lenders. Matters come to ACE’s attention when a milestone payment is queried by Ephemeral, on the grounds of incomplete works. After 3 weeks of frenetic negotiation and claims and counter-claims, it becomes apparent that the disputed items are a cover to buy time for Ephemeral to fund the overdue payment. When payment is made, and the claims suddenly withdrawn, ACE realises that Ephemeral is experiencing severe financial stress. Matters continue to limp along for another 2 months, until Ephemeral again defaults on a payment, which it agrees to pay in 3 instalments over 2 months, overlapping other payments which are scheduled.
If ACE allows the works to proceed, it faces the possibility of expending further monies on unrecoverable supplies to a doubtful debtor. If it demands strict adherence to terms, it will almost certainly precipitate a massive default by Ephemeral, leading to the latter being placed in administration. Every day, ACE is incurring costs of supply to Ephemeral of over $50K.
The board of ACE has an emergency meeting to determine the best course of action. By the time they have met, the exposure to Ephemeral has increased by $300K.
Note: ACE has been aware of Ephemeral’s financial position for some months, and has already compounded a payment. If Ephemeral collapses, its liquidator will certainly demand recovery of preferential payments made to ACE, prior to determining a final payout to all proven creditors of Ephemeral.
ACE’s bankers have detected the blow-out in its borrowings and that this has been matched by extended terms of payment to Ephemeral, as shown on the debtors list. They express significant disquiet over this increased exposure of the bank to ACE, which is not matched by an improved asset position.
The board of ACE is in a quandary – damned if they do (extend terms to Ephemeral), damned if they don’t.


