Workday Adaptive Planning (Adaptive Insights) is a cloud-based Corporate Performance Management solution that makes planning easy and empowers finance teams to better support the business and drive efficiencies.
Workday Adaptive Planning continues to deliver improvements to the software through each release, and has maintained its position as a top performer on sites like Gartner, TrustRadius and G2 crowd for its features and high customer satisfaction rating.
With each release of Workday Adaptive Planning, we update this page so you can:
- Get a breakdown of the latest features and functionalities added
- See how the software has progressed
- Decide what can be implemented for your organisation
The latest release is right below, but if you want to jump to other releases:
Workday Adaptive Planning (Adaptive Insights) release 2021 R1 – March 2021
The first release of Workday Adaptive Planning for 2021 is here! The 2021R1 release has introduced new features for both modeling and reporting, as well as addressing some areas of improvement from previous releases.
Listed below are some of the exciting enhancements users can leverage to improve their budgeting and forecasting for 2021 and beyond.
Suppression in dashboards
In previous releases of Workday Adaptive Planning, users were not able to suppress 0 values in visualisations. This meant that when a column/bar had no data, a blank column/bar would appear. This caused some frustration for users as it had a negative impact on the visibility of the chart. The 2021R1 release has now introduced a suppress feature for charts which will eliminate this concern.
The screenshot below is an example of how the previous release handles 0 values in visualisations. As you can see, the Function (Uncategorised) still appears even though there are no values.

If you compare the first screenshot with the screenshot below, you will notice that the Function (Uncategorised) column has been suppressed as there was no data.

Something to consider with this feature is that suppression will not apply when the visualisation is broken down by time, and it will also not apply to geo maps.
Dashboard view settings
The 2021R1 release includes a new update for context filters in dashboards. By enabling the override default property on the context filter, users can change the default level and time. This has allowed for greater customisation and means that the dashboard filters can be modified to better suit user requirements.
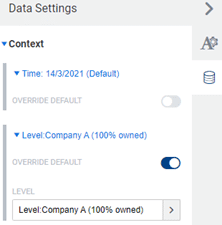
The introduction of this feature is an exciting step in the right direction. However there are some notable limitations. Users are currently unable to set a default time period that is a relative date (for example, prior month or current month), and you are also only able to override the default values for the time and level filters.
Sheets on dashboards
Using sheets in dashboards has become easier in the 2021R1 release with the enhancement of the perspective toolbar.
When using a sheet in the maximised view, the context filters from the perspective toolbar can be used. If there are common filters between the perspective toolbar and the sheet, they will be disabled from the sheet view which means users will need to use the filters from the perspective toolbar instead.
OfficeConnect adhoc analysis
The 2020R2 release introduced the ability to expand and collapse rows and columns to allow for more dynamic reporting. This feature was great as it meant that users could quickly navigate between a high-level view of parent accounts and/or years, or a more detailed view with the children. This did have some limitations, such as the existing report structure interfering with the expand direction as well as limited elements available for expansion.
The 2021R1 release has improved this feature and will help make reporting in OfficeConnect easier and more user-friendly.
Firstly, users are now able to control the direction in which rows and columns expand. From the Workbook properties, there is now an explore tab which hosts these properties.
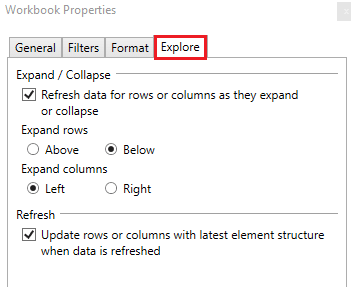
There are also options which allow the user to control the level at which to expand to. Under Expand, there are a few options:
- “Expand” which will expand to the next level down (this was the previous behaviour)
- “Expand All” which will display the entire structure
- “Expand to leaf level” which will only show leaf accounts
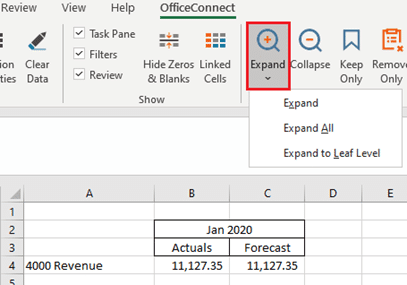
From the ribbon, there are two additional properties that work hand-in-hand with Expand and Collapse. The Keep Only property and the Remove Only property will allow users to select specific rows or columns to “Keep” or “Remove” from an expansion. This gives users more flexibility around which accounts they want to show and hide. It’s important to note here that using these features will break the expansion for further collapsing purposes.
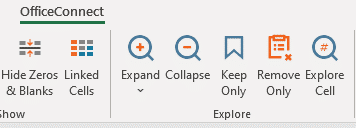
Finally, users are now able to Expand and Collapse on custom dimensions and attributes.
Drill down from cube sheets
A new drill through feature for Actuals on cube sheets has been implemented in the 2021R1 release.
Users now have the option to either drill through by right clicking on a specific cell from a cube sheet, or they use the explore cell feature. This will drill through to a Workday Adaptive Planning report, which has been set up through design integrations.
As mentioned, users must specify which report to drill through to from the design integrations page. From here, you can also specify which parameters will apply to populate the report. One of the great benefits of this feature is that you can specify different drill through reports for different accounts, allowing greater flexibility for reporting and analysis.
A few notes to consider is that the drill through feature is not applicable for attributes or parent accounts.
Derived dimension values on modeled sheet rows
The 2021R1 release has seen some improvements for mapping rules in both derived dimension values and in dashboards. This improvement introduces a new inheritance feature in which mapping rules applied to a parent level will automatically apply to the children of such account. If a mapping rule is applied at a child level, it will override the inheritance for that one instance.
This feature can be turned off by request if there is a specific requirement to have dimension mapping rules applied to a specific level.
Other notable inclusions in 2021R1
The following features are issued with a word of caution. Changes to accounts and versions can impact the current set up and structure of your model. If you are interesting in making any changes to your accounts, it is advised that you contact a QMetrix consultant.
Calculated accounts
Creating calculated accounts has become more flexible in the 2021R1 release with the introduction of a data entry override setting. This will allow users to override the formula for a particular version and allow them to manually enter values without affecting the calculations for other versions.
This feature is available on calculated cube accounts, custom accounts and GL accounts with master formulas.
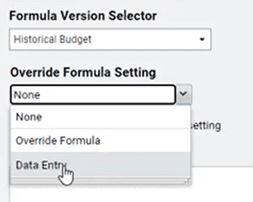
There is also the introduction of a disable version specific formular setting property which allows the user to delete the override formula. When this is enabled, the account will pick up the default formula for all versions (including locked versions).
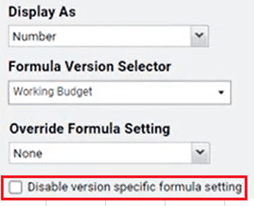
In previous releases, when a version was copied it would only include the default formulas, leaving behind any override properties. Now there is the option to Copy All Override Formulas when you copy versions.
Import cube and modeled accounts
There is now an import account structure button in both the cube and modeled sheet builders. This feature is an excellent addition as it will make the process of managing and updating the account structures of modeled and cube sheets a lot more efficient.
Once you have exported the account structure through Generate Printable View, you will notice that there is now an additional column which holds all the account formulas. With this export, you can modify account details or create additional accounts and then reload this back in through the Import Account Structure button from the toolbar.

Workday Adaptive Planning (Adaptive Insights) release 2020 R2 – September 2020
Workday Adaptive Planning’s 2020R2 release has seen a number of enhancements from all aspects of the interface including Reporting, Modelling and Integration. These enhancements have helped streamline the budgeting and planning process for many of our Workday Adaptive Planning clients.
Some of the more note-worthy enhancements are listed below.
Reviewing Sheets and Dashboards
A new preference feature has been introduced for sheets in dashboards that allow individual users to set their own sheet preferences. This allows for a more customised and personal approach as preferences can be set to suit individual needs and requirements.
Users are able to interact with perspectives as usual,. However when they change filters or a display option, their preferences will be saved and be applied the next time they open the perspective. This feature is completely unique, which means that each user can have their own preferences saved for the same dashboard – eliminating the need to provide multiple views for a different audience.
Context Filters
Context filters on sheets have become more dynamic and user friendly by controlling the filter options available. When an attribute is selected from a context filter, the subsequent level and dimension filters will only be populated with options relevant to the attribute. Not only will this feature make it easier for users to get the most value out of their sheets, but it will also eliminate combinations of attributes, dimensions and levels that are not applicable to each other.
Users are also now able to filter sheets based on whether an element Is Empty or Is Not Empty, which will become particularly useful in data validation processes and to check for data entry errors.
Reporting
Sharing and Reporting in both the web application and OfficeConnect has been improved in a number of ways.
Sharing reports has become more dynamic by allowing reports to be shared to specific users or user groups, as well as level access. Report owners can now nominate precisely who they want to be able to view their report.
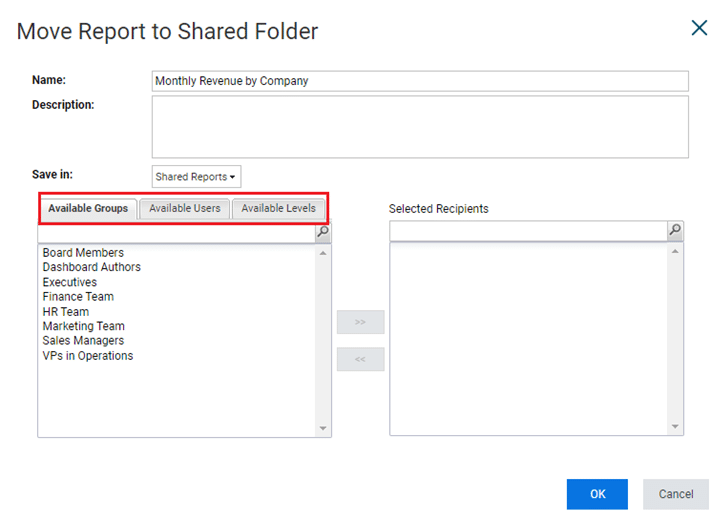
When a report is shared with a user, the user will also need to have the necessary level access to view the data. Whilst they may be able to run a report that has been shared with them, they will only see data if their level access allows them to do so.
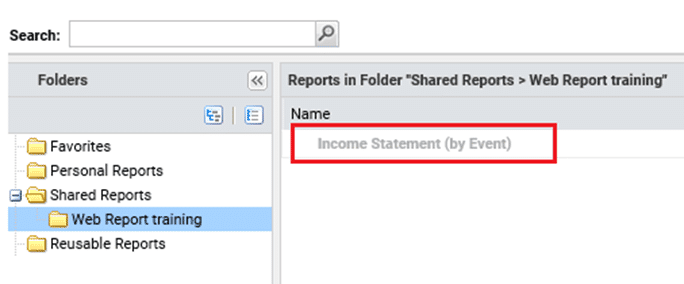
Reports that are saved under a shared folder will be visible to all users who have access to the shared folder – however if a user hasn’t been given specific access to a shared report the report will appear as disabled and it cannot be run.
OfficeConnect reports have also seen some great enhancements.
In the previous 2020 release, a grouping concept was introduced which allowed children accounts of the same parent to be grouped. This meant that when a new child account was added into the model or an account was removed, the elements and groups could be refreshed and updated so that the change was visible in the report. Whilst this made the process of updating reports much more seamless, there were some concerns.
Any existing OfficeConnect reports built prior to the 2020R1 release were not eligible for grouping. That is – the only way to apply the grouping in an existing report was to rebuild the entire reports structure. This meant that a lot of users were not able to reap the full benefits of this feature.
In the 2020R2 release, this feature has been enhanced. Users are now able to update existing reports that were built prior to the 2020R1 release and utilise the grouping functions.
By selecting the accounts from the report, users can either use the Group property from the toolbar or from the context menu.
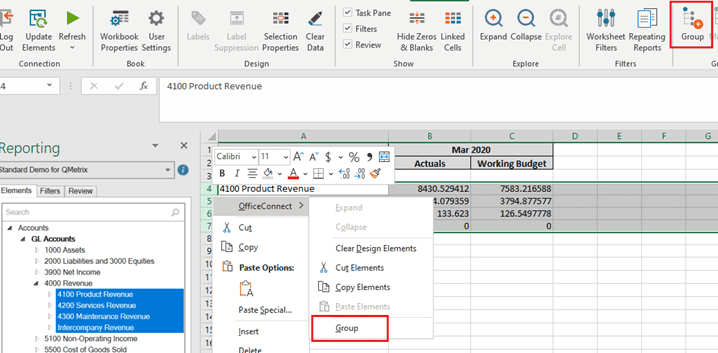
When using the grouping function, all elements must belong to the same parent element.
Groups can now be managed more easily through the Manage property.
The 2020R2 release has also removed the manual process of updating elements by providing a Workbook property to Include Update Groups in Refresh. This means by default, new elements will become available once the report is refreshed.
Modelling
The Workday Adaptive Planning 2020R2 release has introduced the concept of Intelligent Planning and Machine Learning to planning. Machine learning principles are applied to detect and predict any anomalies or outliers in planned versions. This is a brand-new concept for Workday Adaptive Planning, and to enable anomaly detection, users must submit a support ticket.
Using account formulas has become easier with the concept over override formulas. When a version is locked, account formulas are automatically saved as an override formular in that version. This allows edits and modifications to be made to the formulars without impacting the locked versions.
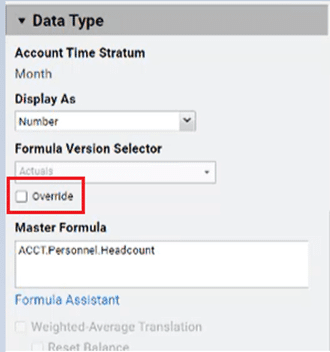
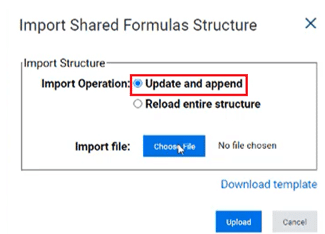
The process of updating shared formulas has also been enhanced. The previous process of modifying a shared formula required users to reload all of the shared formulars for a version back into Workday Adaptive Planning. In the 2020R2 release, there is an option to update and append, which enables users to modify and reload specific formulas.
