IBM Cognos Analytics – What’s New
Introduction
The following are only observations based on a short IBM presentation, not actual usage and does not cover off any architecture or administration functions. As the product has not yet been released, any of the following functions can be changed or removed before its planned released by the end of December 2015. During the presentation there were still a lots of “Coming Soon” sections, so December may be a very ambitious target. As you may have already realised by the name, the numbering system has been abandoned for this release and Cognos has now been rebranded to Cognos Analytics, in line with other products such as Watson Analytics and Planning Analytics.
Portal
The first thing that stands out is the new user interface, it has been completely remodeled. It has a much more modern feel with context sensitive menus that expand and collapse when required. It makes for a more intuitive product and part of the reason behind this is that IBM wants Cognos to be used on any device, regardless of size. For those who still like the “classic” view with breadcrumbs, you can still choose to view it that way.
The welcome screen is much cleaner and comes with samples and videos to facilitate user self-learning. Search functionality is more Google-like with pre-emptive text searching. They also switched common terminology such as “My Folders” and “Public Folders” to “My Content” and “Team Content” to encourage collaboration. Favourites and Recently Used areas have been added to the menus.
Modelling
There is an additional modelling tool which is web based. It’s seems like a light version of Framework Manager and allows for models to be created in a very short amount of time. The models can include multiple data sources and even other published Framework models. The modelling is very basic , allowing for relationships to be created and cardinality to be set, but also things like calculations and basic string manipulation. It does not support anything such as parameter maps or macros and also doesn’t seem to be dimensionally aware. One interesting bit of functionality it has is “pre-emptive” modelling, where the user provides the subject matter they’re about to model and it will search the data source for tables it thinks are related to the search term. IBM indicated that they hoped to eventually move all of the Framework Manager functionality into this tool and remove the need for thick clients and model files.
Contact us to find out more about our Cognos services if you are considering upgrading your existing Cognos BI environment or just wanting to know more about Cognos Analytics.
Reporting
What about the reporting? Unlike the jump from 8 to 10, there are much bigger changes this time around. Here are a few observations:
- A shift towards self-service, user empowerment and an agile way of working.
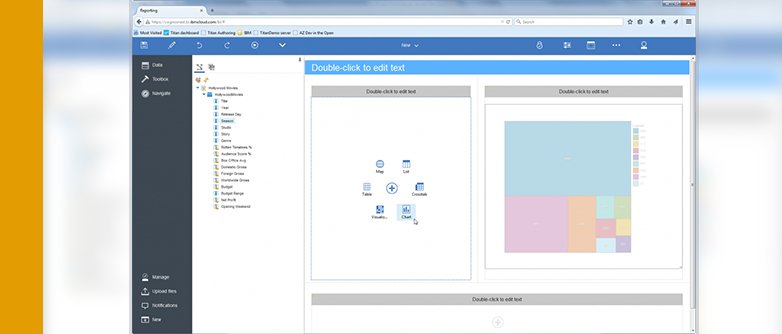
- The ability for users to upload spreadsheets data to the content store allowing for security and auditability. The file upload process uses Watson Analytics to analyse the file and assign correct usage based on the data type. Then, as you drag data items onto the canvas Watson starts to recommend ways to display the data.
- As mentioned in the previous point, there has also been some integration of Watson Analytics, which becomes evident in the new look and feel as well as the visualisation suggestions. The longer term vision appears to be that Watson and Cognos will become much more tightly integrated.
- Static reports now become more interactive with the users able to add filters, calculations, exclusions, etc. Any changes that a users makes to these standard reports will become new content.
- Users now “subscribe” to a report rather than schedule it, and a notification will be sent to the user’s inbox area as to whether or not the subscription was successful.
- When in edit mode you can work in preview mode, i.e. data appearing in report, or design mode (so no need to constantly click that Run button when developing and testing to see your changes!)
- There are new smarts around how objects interact with each other on the canvas. If all objects come from the same query, any user applied filter will be reflected automatically in all objects.
- The use of templates and themes had been made a lot easier in order to keep a common look and feel to the reports.
- Any existing JavaScript will not work and have to be re-written (ouch!)


