A useful method to visually assist users in dissecting and viewing large amounts of rows of information in a TM1 report is having alternative row colours. This can be implemented quickly and easily using conditional formatting and combining two simple MS Excel functions.
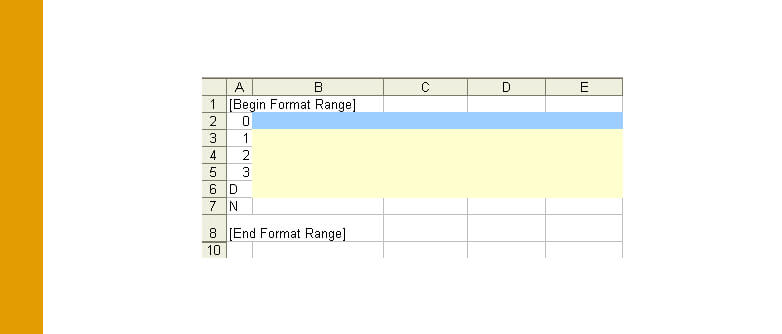
The conditional formatting is performed in the Format Area of the Active Form.
TM1 Active Form Format Area
Depending on the row definition (0, 1, 2, D, N) that you want to colours to alternate on, select the row and column to apply the conditional formatting.
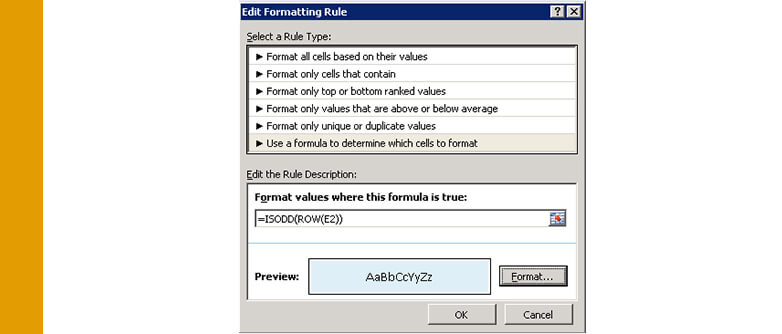
Excel Conditional Formatting for row Definition 0.
The Excel formula ISODD() and ROW() is combined and will return TRUE if the row number is odd or FALSE if the row number is even. Click the Format… button and select the colour you want to apply for odd numbered rows.

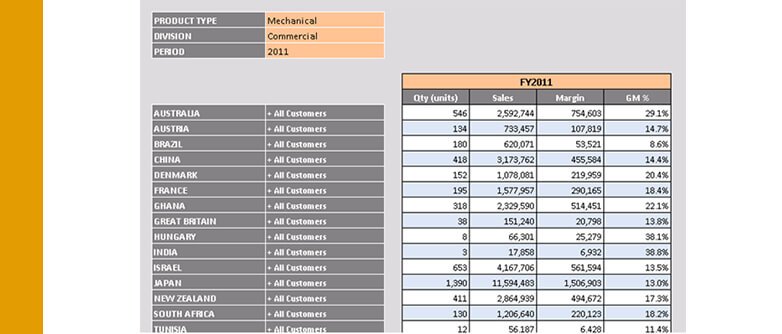
TM1 Active Form with alternative row colours.
When the Active Form is reloaded, the report will apply the conditional formatting and alternate the row colours to make viewing the report easier.
Get more TM1 Tech Tips here.
Learn how QMetrix can assist your organisation with IBM Planning Analytics (TM1).


