Power BI is a well-established business reporting platform that consists of several technologies that help to deliver a broad reaching business intelligence capability. It is an advanced data visualisation, analytical and reporting tool built upon Microsoft cloud computing infrastructure.
As related to any other business solution implementation, it is very important to understand the architecture of Power BI to achieve the best outcome for an organisation’s business intelligence investment, should Power BI be chosen.
This article explains the main components of the Power BI architecture, the security considerations of the product and a few other features.
Power BI architecture
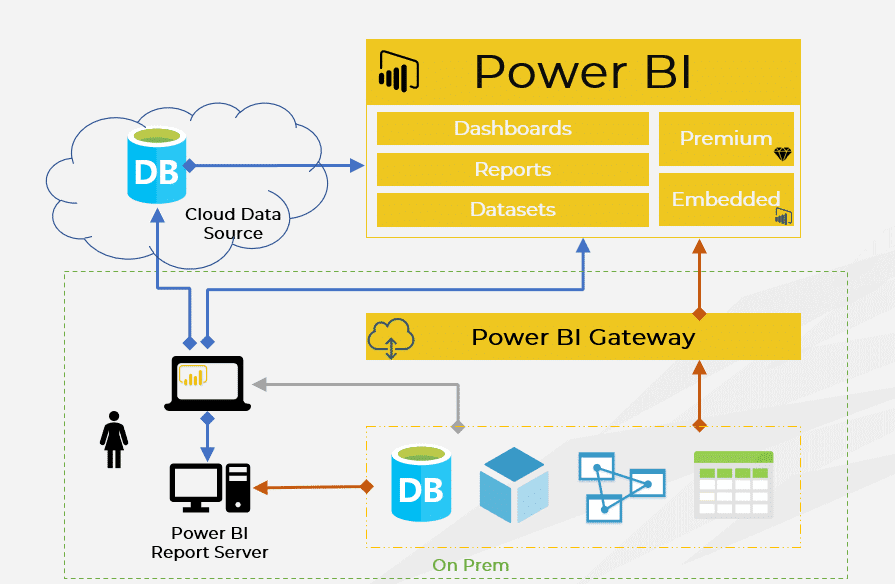
There are several components/steps that work together in Power BI Services to deliver the reporting solution. These are:
- Data sourcing/integration
- Data transformation
- Building reports
- Publishing reports
- Creating dashboards
Let me explain each of these in more detail.
1. Data sourcing/integration
Power BI reports can be comprised of data from various data sources. These data sources can be either online or in your organisation’s local data stores and can take many types and forms.
The Power BI Service has its own inbuilt data connectors which allows easier connectivity to many common data source types, such as SQL server, Oracle, My SQL & Flat files, CSV, Excel and XML. There are other various connectors to source data from online websites, news feeds, SaaS services and social media.
There is a 1GB dataset limit in Power BI for imported datasets, however this restriction can be eliminated by creating a direct or a live connection. The Power BI Gateway is a piece of software that you can install in your local environment that builds the bridge between local on-premise data sources and the Power BI cloud service.
2. Data transformation
At this stage, imported data in the staging area may not be in a form that is suitable for reporting. Therefore, it may be necessary to transform this unstructured data into a more structured and usable format.
The Inbuilt Power Query engine in Power BI Desktop provides a lot of transformation capabilities, such as:
- removing duplicates
- removing or renaming columns
- replacing values with something else
- building relationships
- creating user defined hierarchies
Ideally, underlying source data will be coming from a data warehouse or other structured data source helping to minimise the effort required to transform data.
3. Report building
After sourcing and transforming data, report authors can build Power BI reports and dashboards. There are two main tools which can be used to build reports in Power BI. Power BI Desktop is a free tool available to download and the Power BI Service is an online tool that provides similar capabilities in report building.
Power BI Desktop contains many interactive visualisations (dashboard components) and there are a lot of custom visualisations available in the marketplace too. A broad range of filtering and slicing capabilities are also available in Power BI as in other popular reporting tools.
4. Publishing reports
Once reports are built, they need to be published to the Power BI Service for organisation-wide distribution. Report Authors can publish their reports to the Power BI Service using Power BI Desktop. There are two main areas where reports can be published:
- My Workspace
No one else can access reports published to My Workspace unless shared. It is a good testing area for report authors. - Other Authorised Workspaces
This can act as a central repository for all authorised users to share their reports and collaborate.
5. Creating dashboards
Often the last step in building reporting content is creating dashboards. Authorised users can log in to the Power BI Service and create dashboards by pinning visuals from different reports or an entire report as a live page.
Filtering or slicing is not a feature you find in Power BI dashboards, however dashboard visualisations maintain the filter settings which were selected at the time of pinning the visual from the report.
Power BI dashboards get refreshed every 30 minutes unless you are allocated to a Power BI Premium capacity (more on this licensing option below).
Power BI components, security and data access
Setting up security in Power BI is one of the most complicated and challenging tasks in the project deployment process. Each organisation has their own way of governing user access policies and setting up report access rules.
Power BI is packed with many useful features that help to manage data access policies and user permissions. The following key components work together to deliver a secure reporting environment in Power BI.
Power BI Tenant
When a user logs into Power BI for the first time, a new auto-generated Power BI Tenant is created based on the user’s email address. Similarly, an Admin user can provision a Power BI Tenant for the organisation.
The Power BI Tenant is the main storage component for all the organisation’s Power BI objects.
Power BI Workspace
The Power BI Workspace is a collaborative workspace for Power BI users. It holds a collection of datasets, dashboards and reports for sharing. Report authors publish their artifacts to the Power BI Workspace and share them with the target audience.
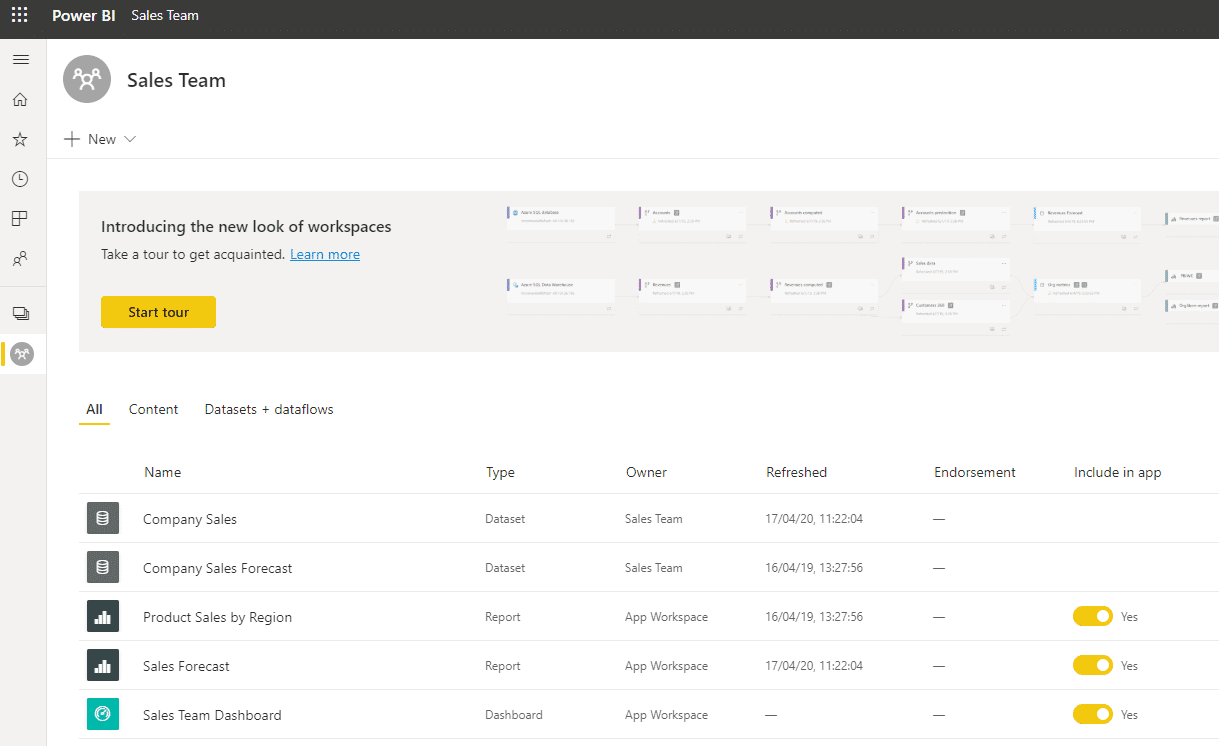
Example of a Power BI Workspace
It is a good practice to group dashboards and reports based on their subject area or usability and publish them to a dedicated workspace. For example, distribute finance reports to a finance workspace, payroll related objects to a payroll workspace and so forth.
Each user has their own workspace called My Workspace and it is a private workspace for individual users.
Workspace content can be bundled to a Power BI app and distributed to the entire organisation or a specific user group or an individual. As of writing, Power BI only allows the creation of one Power BI App per Workspace.
Workspace permission
There are four main Roles to set up Workspace permission.
- Admin: Admin users have permission to create and delete Workspaces and update Workspace settings. They can add members to the workspace and create apps. Admin users have the highest access level and are also responsible for managing content in the workspace.
- Member: Members cannot create and delete Workspaces or update Workspace settings. Nor do they have permission to add Admin users to the Workspace. Other than these restrictions, they can create Power BI Apps, share content, and manage Workspace content.
- Contributor: Contributors can manage Workspace content, but they are not allowed to manage Workspace permission.
- Viewer: Workspace Viewers can view and interact with Workspace items and read data stored in Workspace dataflows. Viewers have the lowest level permission that can be assigned to an individual or a user group.
Power BI Admin portal
Power BI Tenant administration and various other admin tasks are accomplished through the Power BI Admin portal.
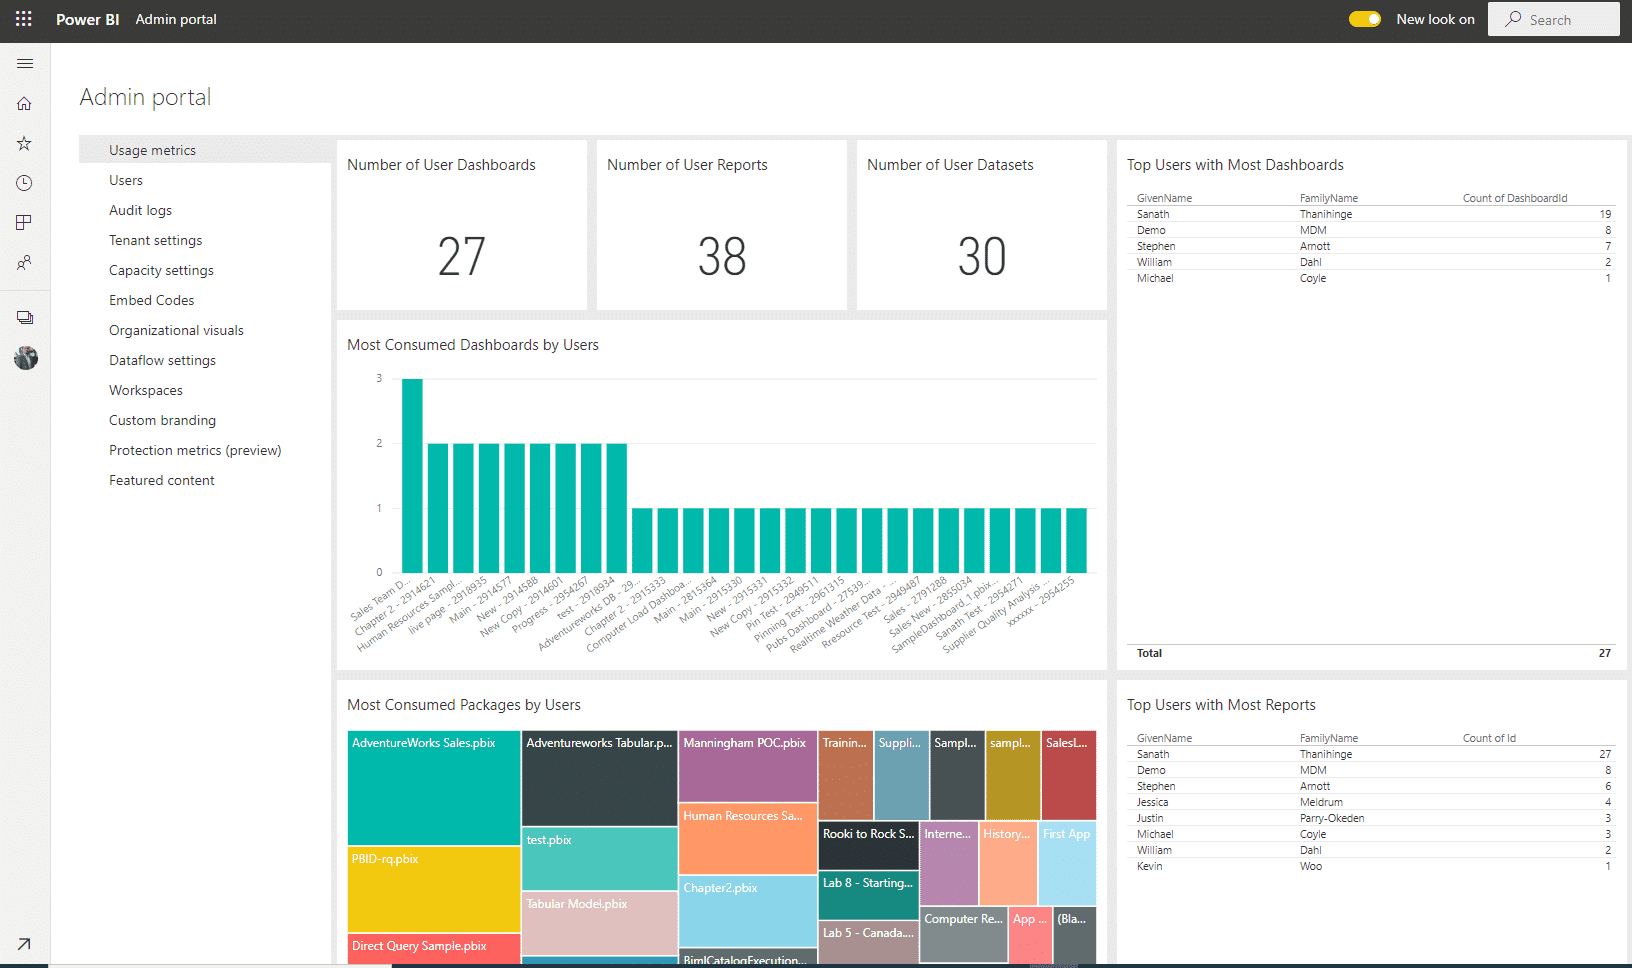
Example of a Power BI Admin Portal
At least one of the Admin users should be assigned to the “Power BI Administrator” role to manage the Power BI Tenant.
Power BI Admins manage global settings of the Power BI Tenant such as Workspace settings, export and sharing settings, content pack and Admin settings through the Power BI Admin portal.
Office 365 Admin Centre
This is the global Active Directory User admin console for the organisation’s tenancy. Admin users can manage users, user groups and assign licences and subscriptions through Office 365 Admin.
Assigning a Power BI license is also done through the Office 365 Admin console.
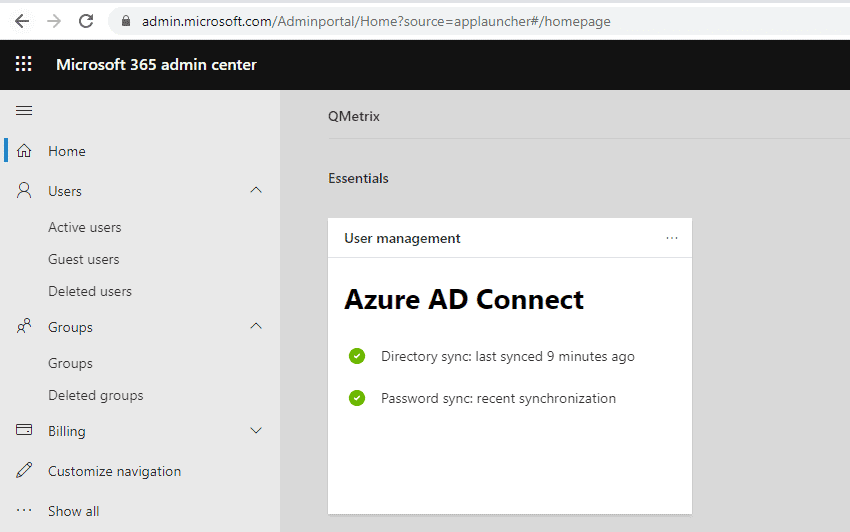
Example of a Microsoft 365 admin center
The Power BI user licence can either be a free licence or a paid Pro licence based on the needs of the user and their responsibility within the organisation.
- Power BI Free: Suitable for any user who needs read-only access free features or for access to Apps in Power BI Premium
- Power BI Pro: Suitable to create and share content in Workspace Apps, for report sharing and other cooperative teamwork.
When there is a new Workspace created in Power BI, an associated user group is also created in the Office 365 centre. Admin users can manage user permissions to the new Workspace through this Office 365 user group.
However, in the latest release, Workspaces can be created without creating the Office 365 user group.
Restricted data access and Row Level Security (RLS)
Report authors may like to secure sensitive data from unauthorised access.
For example, detailed payroll information can only be shared among HR users, whereas finance users may only be allowed to see summarised payroll information. Individual employees themselves will have zero visibility of an individual’s salaries and wages.
In another example, an organisation’s regional sales data should be freely available to all the employees located in that region, but to no one else outside that region.
In these scenarios, report and dashboard access should only be made available to specific user groups or individuals. This can be achieved by implementing Row Level Security (RLS) in Power BI. RLS can be used to restrict data access based on the user visibility policies setup in the data model.
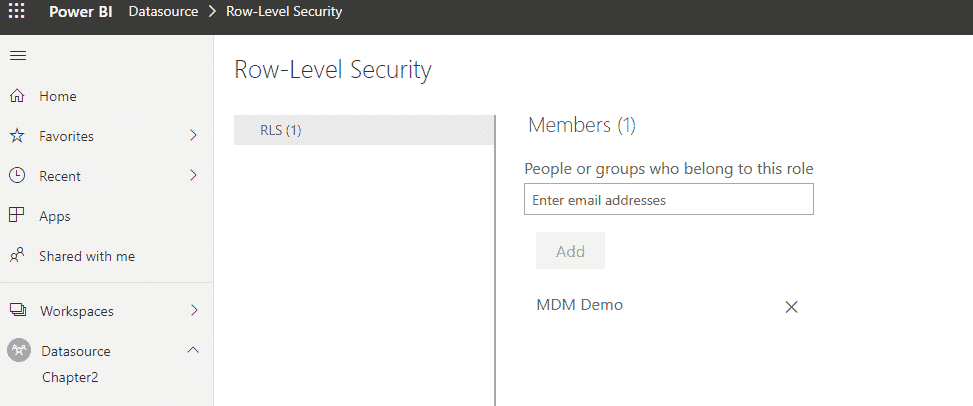
Row Level Security (RLS): How to add users to a role
RLS can be configured in both imported datasets as well as direct queries. When using Microsoft Analysis Service cubes, RLS can be implemented outside of Power BI and implemented in the source cube. That is a centralised approach to a model design and there are several benefits of doing this.
If the security model is embedded into the Power BI model, there is no data protection at the data source level. Therefore, any other reporting tool that consumes the same data source must duplicate the RLS logic in its presentation layer.
This may add maintenance overhead and extra complexity to the reporting solution. Therefore, it is very important to consider where RLS will be implemented, whether that be in the reporting layer or, preferably, in the data source layer.
Dashboard and report sharing
Power BI dashboards and reports need to be shared to give other users access to Power BI content. Sharing Power BI content requires a Power BI Pro licence. Even report consumers need a Power BI Pro license unless content is in the Power BI Premium capacity.
If you are an Admin, Member or Contributor user, Power BI content can be shared, although shared content cannot be edited. Re-sharing is only possible if you are giving them permission to do so.
Organisational content can also be shared with external users, but these external users also need to have their own Power BI Pro licence, or you need to allocate a Power BI Pro licence from your tenant. External users can view shared content, but they cannot edit it unless you authorise them to do so.
Power BI Premium capacity
In shared Power BI Services, workloads run on shared resources, whereas Power BI Premium is a dedicated storage capacity for your organisation (Software-as-a-Service).
An organisation’s content in Power BI Premium can be shared among internal users and partners, as well as other external stakeholders without any additional licensing cost.
There are several potential benefits in using Power BI Premium:
- Improved performance and response time
- Greater scalability
- Higher refresh intervals for datasets, dashboards and reports
- Power BI collections can be shared with anyone without purchasing a per-user licence
- Extended local reporting server infrastructure
- Flexible user licencing by capacity
Power BI Premium subscription and licensing
Power BI Premium is a tenant level Office 365 subscription and available in two different forms:
- P SKU: This is a monthly or annual commitment that is billed monthly and the Power BI reporting server is available to install on-premise.
- EM SKU: This is an annual commitment that is billed monthly and only available through volume licensing plans. EM SKUs are not available to purchase directly.
Azure Power BI Embedded capacity
Power BI Embed is a Platform as a Service (PaaS) analytical solution that has been crafted for Independent Software Vendors (ISVs) who want to embed Power BI visualisations into their applications or web portals.
It allows report authors and developers to add visuals and existing reports into their business applications quickly. This eliminates development effort and helps to maintain the same look and feel throughout every application.
Compared to Power BI Premium that is a monthly commitment, Power BI Embed is a pay-as-you-go feature that can potentially reduce software costs. To embed Power BI visuals into your application, a Power BI Pro License is required.
Implementing Power BI
When it comes to implementing any business technology solution, it is important to understand its various features and capabilities and how they can be applied to the organisation’s requirements. Moreover, having an overarching plan is vital.
At QMetrix we have seen instances where BI solutions are implemented in a piecemeal fashion without much initial thought to the end-game, success criteria and indeed, the right architecture to improve the chances of success.
Ad-hoc approaches and point solutions can and do lead to messy environments that require far too much maintenance effort, whilst the overall goals of the BI solution are rarely achieved.
It is important to consider the architecture, security and other elements listed in this article, as well as broader considerations such as a developing a BI strategy and roadmap before diving into a Power BI implementation.
A little more effort upfront will ensure you will be off to a much better start, and reap a far better return on investment on your business intelligence and analytics efforts.